Use your browser’s Find (Ctrl+F / ⌘F) to locate a setting. Open its row for the full explanation and limits. Source-check time is a verification timestamp, not a script publication date.
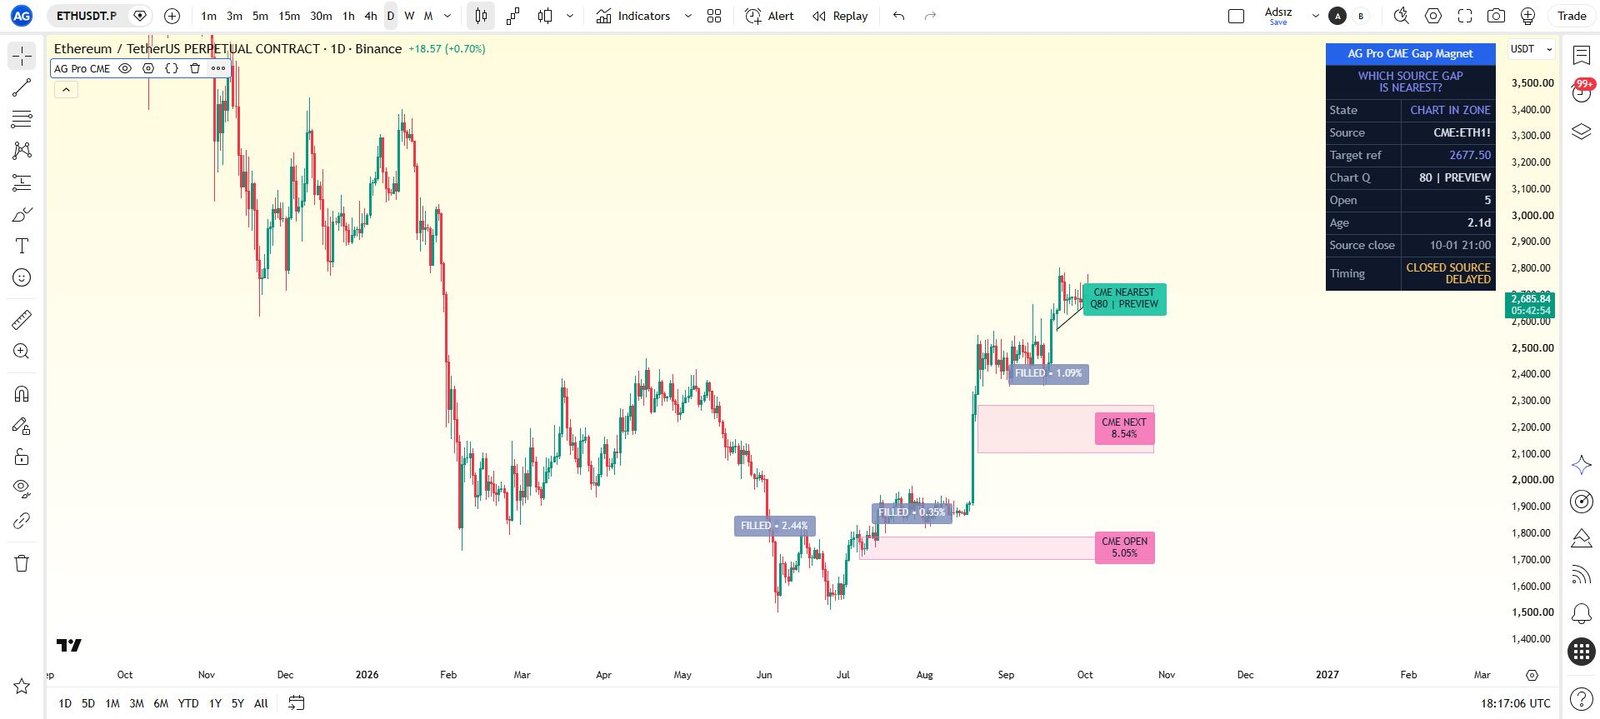
General & Display
12 inputsShow Panel
- Input type
bool- Source default
true- Available options
Not specified in source- Minimum
Not specified in source- Maximum
Not specified in source- Step
Not specified in source
What it controls
Toggle the on-chart decision panel.
Effect on the script
Enabled by default.
When to adjust it
Show the panel to inspect the state and evidence, or hide it when chart space is the immediate priority.
Interpretation and limits
Hiding the panel is a presentation choice; do not treat missing rows as missing risk.
Original input tooltip
Toggle the on-chart decision panel. Enabled by default.
Panel Theme
- Input type
string- Source default
"Dark"- Available options
["Dark", "Light"]- Minimum
Not specified in source- Maximum
Not specified in source- Step
Not specified in source
What it controls
Selects the available panel contrast theme.
Effect on the script
Selects the panel background, border, and text color scheme used for contrast.
When to adjust it
Choose the available theme that keeps the panel readable against the chart background.
Interpretation and limits
A theme changes appearance; it does not change event qualification or statistical evidence.
Panel Location
- Input type
string- Source default
"Top Right"- Available options
["Top Right", "Top Left", "Bottom Right", "Bottom Left", "Middle Right"]- Minimum
Not specified in source- Maximum
Not specified in source- Step
Not specified in source
What it controls
Selects where the workflow panel is placed on the chart.
Effect on the script
Selects the table position used by the panel renderer.
When to adjust it
Move the panel when it overlaps active candles, the current workflow zone, or reference labels.
Interpretation and limits
Panel placement changes presentation, not the detected context or observation accounting.
Panel Font Size
- Input type
string- Source default
"Normal"- Available options
["Small", "Normal", "Large"]- Minimum
Not specified in source- Maximum
Not specified in source- Step
Not specified in source
What it controls
Controls the text size for panel font size.
Effect on the script
Controls the text-size mapping used by the relevant panel or chart-label renderer.
When to adjust it
Adjust it for the chart size and viewing distance while preserving readable boundaries and state information.
Interpretation and limits
A larger font can increase chart overlap. Text size does not change the analytical observations.
Label Font Size
- Input type
string- Source default
"Normal"- Available options
["Small", "Normal", "Large"]- Minimum
Not specified in source- Maximum
Not specified in source- Step
Not specified in source
What it controls
Controls the text size for label font size.
Effect on the script
Controls the text-size mapping used by the relevant panel or chart-label renderer.
When to adjust it
Adjust it for the chart size and viewing distance while preserving readable boundaries and state information.
Interpretation and limits
A larger font can increase chart overlap. Text size does not change the analytical observations.
Panel Page
- Input type
string- Source default
"Overview"- Available options
["Overview", "Factors", "Evidence"]- Minimum
Not specified in source- Maximum
Not specified in source- Step
Not specified in source
What it controls
Separate live chart-price context from confirmed source observations; none of the scores are probabilities.
Effect on the script
Selects which already calculated information is presented in the visible panel or summary view.
When to adjust it
Use the current-state view for orientation and the available evidence/audit view when checking observation provenance and exclusions.
Interpretation and limits
A compact or hidden view does not remove the limitations of the underlying observations.
Original input tooltip
Separate live chart-price context from confirmed source observations; none of the scores are probabilities.
Show Gap Zones
- Input type
bool- Source default
true- Available options
Not specified in source- Minimum
Not specified in source- Maximum
Not specified in source- Step
Not specified in source
What it controls
Draw each tracked CME gap as a zone with a centered label.
Effect on the script
Controls visibility of the chart element named by this setting.
When to adjust it
Toggle it to inspect that element or make space for the current chart review.
Interpretation and limits
A visibility switch does not turn a visual reference into an executed order or validated result.
Original input tooltip
Draw each tracked CME gap as a zone with a centered label.
Zone Layout
- Input type
string- Source default
"Classic"- Available options
["Classic", "Forward"]- Minimum
Not specified in source- Maximum
Not specified in source- Step
Not specified in source
What it controls
Classic restores extended historical gap zones.
Effect on the script
Forward uses compact future projections. Source detection and fill statistics are identical.
When to adjust it
Change it only when the specific analytical or presentation question in the tooltip changes.
Interpretation and limits
Record the configuration when comparing observations; a changed setting is not proof of a stronger future result.
Original input tooltip
Classic restores extended historical gap zones. Forward uses compact future projections. Source detection and fill statistics are identical.
Classic Zone History (Bars)
- Input type
int- Source default
180- Available options
Not specified in source- Minimum
20- Maximum
2000- Step
Not specified in source
What it controls
Maximum historical width of an open zone.
Effect on the script
Prevents very old gaps from covering the entire chart.
When to adjust it
Change it only when the specific analytical or presentation question in the tooltip changes.
Interpretation and limits
Record the configuration when comparing observations; a changed setting is not proof of a stronger future result.
Original input tooltip
Maximum historical width of an open zone. Prevents very old gaps from covering the entire chart.
Show Magnet Line
- Input type
bool- Source default
true- Available options
Not specified in source- Minimum
Not specified in source- Maximum
Not specified in source- Step
Not specified in source
What it controls
Draw a line from current price to the nearest unfilled gap (the magnet target).
Effect on the script
Controls visibility of the chart element named by this setting.
When to adjust it
Toggle it to inspect that element or make space for the current chart review.
Interpretation and limits
A visibility switch does not turn a visual reference into an executed order or validated result.
Original input tooltip
Draw a line from current price to the nearest unfilled gap (the magnet target).
Show Score on Nearest Gap
- Input type
bool- Source default
true- Available options
Not specified in source- Minimum
Not specified in source- Maximum
Not specified in source- Step
Not specified in source
What it controls
Show the chart-context heuristic on the nearest gap badge.
Effect on the script
It is not a forecast or probability.
When to adjust it
Toggle it to inspect that element or make space for the current chart review.
Interpretation and limits
A visibility switch does not turn a visual reference into an executed order or validated result.
Original input tooltip
Show the chart-context heuristic on the nearest gap badge. It is not a forecast or probability.
Show Filled Gaps
- Input type
bool- Source default
true- Available options
Not specified in source- Minimum
Not specified in source- Maximum
Not specified in source- Step
Not specified in source
What it controls
Keep recently filled gaps on the chart, faded, ending at the bar where they filled.
Effect on the script
Controls visibility of the chart element named by this setting.
When to adjust it
Toggle it to inspect that element or make space for the current chart review.
Interpretation and limits
A visibility switch does not turn a visual reference into an executed order or validated result.
Original input tooltip
Keep recently filled gaps on the chart, faded, ending at the bar where they filled.
Gap Source
6 inputsAuto-Match CME Symbol
- Input type
bool- Source default
true- Available options
Not specified in source- Minimum
Not specified in source- Maximum
Not specified in source- Step
Not specified in source
What it controls
Automatically map the chart base currency to its CME futures (BTC -> CME:BTC1!, ETH -> CME:ETH1!).
Effect on the script
Turn off to set a custom source below.
When to adjust it
Change it only when the specific analytical or presentation question in the tooltip changes.
Interpretation and limits
Record the configuration when comparing observations; a changed setting is not proof of a stronger future result.
Original input tooltip
Automatically map the chart base currency to its CME futures (BTC -> CME:BTC1!, ETH -> CME:ETH1!). Turn off to set a custom source below.
Custom CME Symbol
- Input type
symbol- Source default
"CME:BTC1!"- Available options
Not specified in source- Minimum
Not specified in source- Maximum
Not specified in source- Step
Not specified in source
What it controls
Used only when Auto-Match is off.
Effect on the script
Applies this parameter to the component and behavior stated in its source tooltip.
When to adjust it
Change it only when the specific analytical or presentation question in the tooltip changes.
Interpretation and limits
Record the configuration when comparing observations; a changed setting is not proof of a stronger future result.
Original input tooltip
Used only when Auto-Match is off.
Gap Timeframe
- Input type
timeframe- Source default
"D"- Available options
Not specified in source- Minimum
Not specified in source- Maximum
Not specified in source- Step
Not specified in source
What it controls
Source resolution for confirmed open-to-prior-close gaps.
Effect on the script
The chart must be at or below this resolution and no higher than daily. A completed source bar is processed when the next source bar becomes available.
When to adjust it
Change it only when the specific analytical or presentation question in the tooltip changes.
Interpretation and limits
Record the configuration when comparing observations; a changed setting is not proof of a stronger future result.
Original input tooltip
Source resolution for confirmed open-to-prior-close gaps. The chart must be at or below this resolution and no higher than daily. A completed source bar is processed when the next source bar becomes available.
Long Source-Bar Breaks Only
- Input type
bool- Source default
false- Available options
Not specified in source- Minimum
Not specified in source- Maximum
Not specified in source- Step
Not specified in source
What it controls
Require more than 1.5 calendar days between source-bar openings.
Effect on the script
This is a historical long-break filter, not a current CME schedule model. Default off supports session discontinuities under 24/7 trading; daily bars cannot isolate short maintenance breaks.
When to adjust it
Change it only when the specific analytical or presentation question in the tooltip changes.
Interpretation and limits
Default off supports session discontinuities under 24/7 trading; daily bars cannot isolate short maintenance breaks.
Original input tooltip
Require more than 1.5 calendar days between source-bar openings. This is a historical long-break filter, not a current CME schedule model. Default off supports session discontinuities under 24/7 trading; daily bars cannot isolate short maintenance breaks.
Minimum Gap Size (%)
- Input type
float- Source default
0.3- Available options
Not specified in source- Minimum
0.0- Maximum
20.0- Step
0.1
What it controls
Ignore gaps smaller than this percentage of price.
Effect on the script
Applies this parameter to the component and behavior stated in its source tooltip.
When to adjust it
Change it only when the specific analytical or presentation question in the tooltip changes.
Interpretation and limits
Record the configuration when comparing observations; a changed setting is not proof of a stronger future result.
Original input tooltip
Ignore gaps smaller than this percentage of price.
Max Drawn Open Gaps
- Input type
int- Source default
10- Available options
Not specified in source- Minimum
1- Maximum
30- Step
Not specified in source
What it controls
How many recent open gaps are drawn on the chart.
Effect on the script
The statistics cover the retained last 200 gaps; discarded open records are counted.
When to adjust it
Change it only when the specific analytical or presentation question in the tooltip changes.
Interpretation and limits
Record the configuration when comparing observations; a changed setting is not proof of a stronger future result.
Original input tooltip
How many recent open gaps are drawn on the chart. The statistics cover the retained last 200 gaps; discarded open records are counted.
Readiness Engine
5 inputsPull Range (ATR)
- Input type
float- Source default
8.0- Available options
Not specified in source- Minimum
1.0- Maximum
100.0- Step
0.5
What it controls
Distance (in daily ATR) at which the proximity factor fades to zero.
Effect on the script
Sets the distance where the proximity component reaches zero and the boundary of the in-range state, using daily ATR.
When to adjust it
Change it only when the specific analytical or presentation question in the tooltip changes.
Interpretation and limits
Record the configuration when comparing observations; a changed setting is not proof of a stronger future result.
Original input tooltip
Distance (in daily ATR) at which the proximity factor fades to zero. Daily ATR keeps distance normalized across chart timeframes; Momentum Lookback remains chart-timeframe based. Closer gaps score higher.
Approach Distance (ATR)
- Input type
float- Source default
2.0- Available options
Not specified in source- Minimum
0.25- Maximum
50.0- Step
0.25
What it controls
When price is within this many daily ATR of the nearest gap, the state becomes Approaching.
Effect on the script
Applies this parameter to the component and behavior stated in its source tooltip.
When to adjust it
Change it only when the specific analytical or presentation question in the tooltip changes.
Interpretation and limits
Record the configuration when comparing observations; a changed setting is not proof of a stronger future result.
Original input tooltip
When price is within this many daily ATR of the nearest gap, the state becomes Approaching.
Momentum Lookback
- Input type
int- Source default
10- Available options
Not specified in source- Minimum
2- Maximum
200- Step
Not specified in source
What it controls
Bars used to measure whether price is currently moving toward the gap.
Effect on the script
Drives the Momentum factor.
When to adjust it
Change it when comparing a different analytical horizon and record the configuration alongside the observations.
Interpretation and limits
Different windows produce different contexts and are not evidence of an improved future result.
Original input tooltip
Bars used to measure whether price is currently moving toward the gap. Drives the Momentum factor.
Gap Aging Horizon (Days)
- Input type
float- Source default
14.0- Available options
Not specified in source- Minimum
1.0- Maximum
120.0- Step
1.0
What it controls
Age in days at which the Freshness factor reaches zero.
Effect on the script
Sets the age at which the linear freshness component reaches zero, with the result bounded to its display range.
When to adjust it
Change it only when the specific analytical or presentation question in the tooltip changes.
Interpretation and limits
Freshness is a heuristic preference, not an estimated fill probability.
Original input tooltip
Age in days at which the Freshness factor reaches zero. Freshness is a heuristic preference, not an estimated fill probability.
Reference Gap Size (%)
- Input type
float- Source default
3.0- Available options
Not specified in source- Minimum
0.5- Maximum
30.0- Step
0.1
What it controls
Gap size treated as large.
Effect on the script
The Size factor heuristically prefers smaller gaps; it is not a calibrated likelihood.
When to adjust it
Change it only when the specific analytical or presentation question in the tooltip changes.
Interpretation and limits
The Size factor heuristically prefers smaller gaps; it is not a calibrated likelihood.
Original input tooltip
Gap size treated as large. The Size factor heuristically prefers smaller gaps; it is not a calibrated likelihood.
Risk
2 inputsPreview Risk Buffer (ATR)
- Input type
float- Source default
1.0- Available options
Not specified in source- Minimum
0.0- Maximum
10.0- Step
0.1
What it controls
Moving chart-price reference padded by daily ATR.
Effect on the script
This is not a fixed stop or an execution model.
When to adjust it
Change it only when the specific analytical or presentation question in the tooltip changes.
Interpretation and limits
This is not a fixed stop or an execution model.
Original input tooltip
Moving chart-price reference padded by daily ATR. This is not a fixed stop or an execution model.
ATR Length
- Input type
int- Source default
14- Available options
Not specified in source- Minimum
1- Maximum
Not specified in source- Step
Not specified in source
What it controls
Controls atr length within the Risk settings group.
Effect on the script
Changes the ATR measurement window used by the documented volatility and distance calculations.
When to adjust it
Adjust it only when deliberately comparing a different volatility baseline.
Interpretation and limits
A different ATR unit changes the reference context; it does not make adverse price movement safely bounded.
Labels & Performance
4 inputsZone Forward Bars
- Input type
int- Source default
20- Available options
Not specified in source- Minimum
12- Maximum
100- Step
Not specified in source
What it controls
How many bars an open gap zone is projected to the right.
Effect on the script
Controls the horizontal extent or placement of the relevant chart drawing in bars.
When to adjust it
Adjust it when the available forward chart space or the intended visual review area changes.
Interpretation and limits
Drawing farther to the right does not extend event validity or establish that price will reach a reference.
Original input tooltip
How many bars an open gap zone is projected to the right.
Recent Filled Gap Labels
- Input type
int- Source default
3- Available options
Not specified in source- Minimum
0- Maximum
8- Step
Not specified in source
What it controls
Maximum number of recent resolved gap zones retained as quiet historical context.
Effect on the script
Applies this parameter to the component and behavior stated in its source tooltip.
When to adjust it
Change it only when the specific analytical or presentation question in the tooltip changes.
Interpretation and limits
Record the configuration when comparing observations; a changed setting is not proof of a stronger future result.
Original input tooltip
Maximum number of recent resolved gap zones retained as quiet historical context.
Filled Label Cooldown (Bars)
- Input type
int- Source default
52- Available options
Not specified in source- Minimum
10- Maximum
250- Step
Not specified in source
What it controls
Minimum horizontal separation between resolved-gap badges.
Effect on the script
Higher values reduce clustering around candles.
When to adjust it
Adjust only after distinguishing display-label spacing from a cooldown that changes accepted-event selection.
Interpretation and limits
A selection cooldown can change the sample. Display spacing alone must not be interpreted as better analytical performance.
Original input tooltip
Minimum horizontal separation between resolved-gap badges. Higher values reduce clustering around candles.
Calculation Window (Bars)
- Input type
int- Source default
5000- Available options
Not specified in source- Minimum
200- Maximum
20000- Step
Not specified in source
What it controls
How many recent bars the engine processes.
Effect on the script
Restricts processing to the stated number of recent chart bars; it therefore changes the history available to the working gap study.
When to adjust it
Change it only when the specific analytical or presentation question in the tooltip changes.
Interpretation and limits
Record the configuration when comparing observations; a changed setting is not proof of a stronger future result.
Original input tooltip
How many recent bars the engine processes. Lower = faster draw on long histories.
Keep the settings in context
Change one analytical assumption at a time and compare the same instrument, timeframe and history. A chart reference, score, observation rate or input default does not establish a trade fill, a forward probability or a guaranteed outcome.
Return to the product overview · View this script on TradingView