Use your browser’s Find (Ctrl+F / ⌘F) to locate a setting. Open its row for the full explanation and limits. Source-check time is a verification timestamp, not a script publication date.
Rotation Engine
6 inputsPlanner Mode
- Input type
string- Source default
"Auto"- Available options
["Auto", "Leadership Focus", "Weakness Focus"]- Minimum
Not specified in source- Maximum
Not specified in source- Step
Not specified in source
What it controls
Controls which rotation side is emphasized. Auto evaluates leadership and weakness from the current chart symbol relative to the benchmark.
Effect on the script
This selects which documented analytical mode, source or directional context the workflow evaluates.
When to adjust it
Choose the mode that corresponds to your actual analysis before inspecting historical examples.
Interpretation and limits
A selected direction or model is a configuration choice, not evidence that price must follow it.
Original input tooltip
Controls which rotation side is emphasized. Auto evaluates leadership and weakness from the current chart symbol relative to the benchmark.
Benchmark Symbol
- Input type
symbol- Source default
"CRYPTOCAP:TOTAL"- Available options
Not specified in source- Minimum
Not specified in source- Maximum
Not specified in source- Step
Not specified in source
What it controls
Reference for aligned close-to-close performance comparison. TOTAL is a market-cap context index, not a tradable return. Consider quote-currency effects when comparing assets. Missing or misaligned data suspends the score.
Effect on the script
This selects the external reference series used by the documented contextual comparison.
When to adjust it
Choose a reference with a defensible relationship to the active chart, matching the question and units of the study.
Interpretation and limits
Missing, stale or unsuitable reference data can invalidate a comparison. Present relative behavior does not guarantee future correlation or outperformance.
Original input tooltip
Reference for aligned close-to-close performance comparison. TOTAL is a market-cap context index, not a tradable return. Consider quote-currency effects when comparing assets. Missing or misaligned data suspends the score.
Pinned Symbol
- Input type
symbol- Source default
"BINANCE:BTCUSDT"- Available options
Not specified in source- Minimum
Not specified in source- Maximum
Not specified in source- Step
Not specified in source
What it controls
Optional comparison symbol displayed in the panel and chart labels. It is not a scanner; it is a pinned reference for context.
Effect on the script
This selects the external reference series used by the documented contextual comparison.
When to adjust it
Choose a reference with a defensible relationship to the active chart, matching the question and units of the study.
Interpretation and limits
Missing, stale or unsuitable reference data can invalidate a comparison. Present relative behavior does not guarantee future correlation or outperformance.
Original input tooltip
Optional comparison symbol displayed in the panel and chart labels. It is not a scanner; it is a pinned reference for context.
Rotation Lookback
- Input type
int- Source default
55- Available options
Not specified in source- Minimum
20- Maximum
240- Step
Not specified in source
What it controls
Aligned return window and activity/volatility baseline. Requires positive chart and benchmark closes at matching current and starting timestamps, plus a complete positive-volume window.
Effect on the script
This changes the observation window or sensitivity of the named calculation feeding the workflow.
When to adjust it
Match the calculation horizon to the analytical question and keep it recorded when comparing results.
Interpretation and limits
Changing the window changes the historical context and can alter warm-up, states and observations. It does not validate a future edge.
Original input tooltip
Aligned return window and activity/volatility baseline. Requires positive chart and benchmark closes at matching current and starting timestamps, plus a complete positive-volume window.
Rotation Strictness
- Input type
string- Source default
"Balanced"- Available options
["Relaxed", "Balanced", "Strict"]- Minimum
Not specified in source- Maximum
Not specified in source- Step
Not specified in source
What it controls
Controls how demanding the rotation score must be before leadership or opportunity states improve.
Effect on the script
This changes how demanding the named qualification, pressure or pattern-fit assessment is.
When to adjust it
Define the selectivity appropriate to the specific structural or flow question before comparing examples.
Interpretation and limits
A more permissive setting can admit marginal context; stricter qualification can delay or exclude events. Neither guarantees better outcomes.
Original input tooltip
Controls how demanding the rotation score must be before leadership or opportunity states improve.
Weakness Strictness
- Input type
string- Source default
"Balanced"- Available options
["Relaxed", "Balanced", "Strict"]- Minimum
Not specified in source- Maximum
Not specified in source- Step
Not specified in source
What it controls
Controls how quickly deterioration pressure rises when relative strength, momentum, or volume activity weaken.
Effect on the script
This changes how demanding the named qualification, pressure or pattern-fit assessment is.
When to adjust it
Define the selectivity appropriate to the specific structural or flow question before comparing examples.
Interpretation and limits
A more permissive setting can admit marginal context; stricter qualification can delay or exclude events. Neither guarantees better outcomes.
Original input tooltip
Controls how quickly deterioration pressure rises when relative strength, momentum, or volume activity weaken.
Visuals
6 inputsVisual Preset
- Input type
string- Source default
"Balanced"- Available options
["Clean", "Balanced", "Rich"]- Minimum
Not specified in source- Maximum
Not specified in source- Step
Not specified in source
What it controls
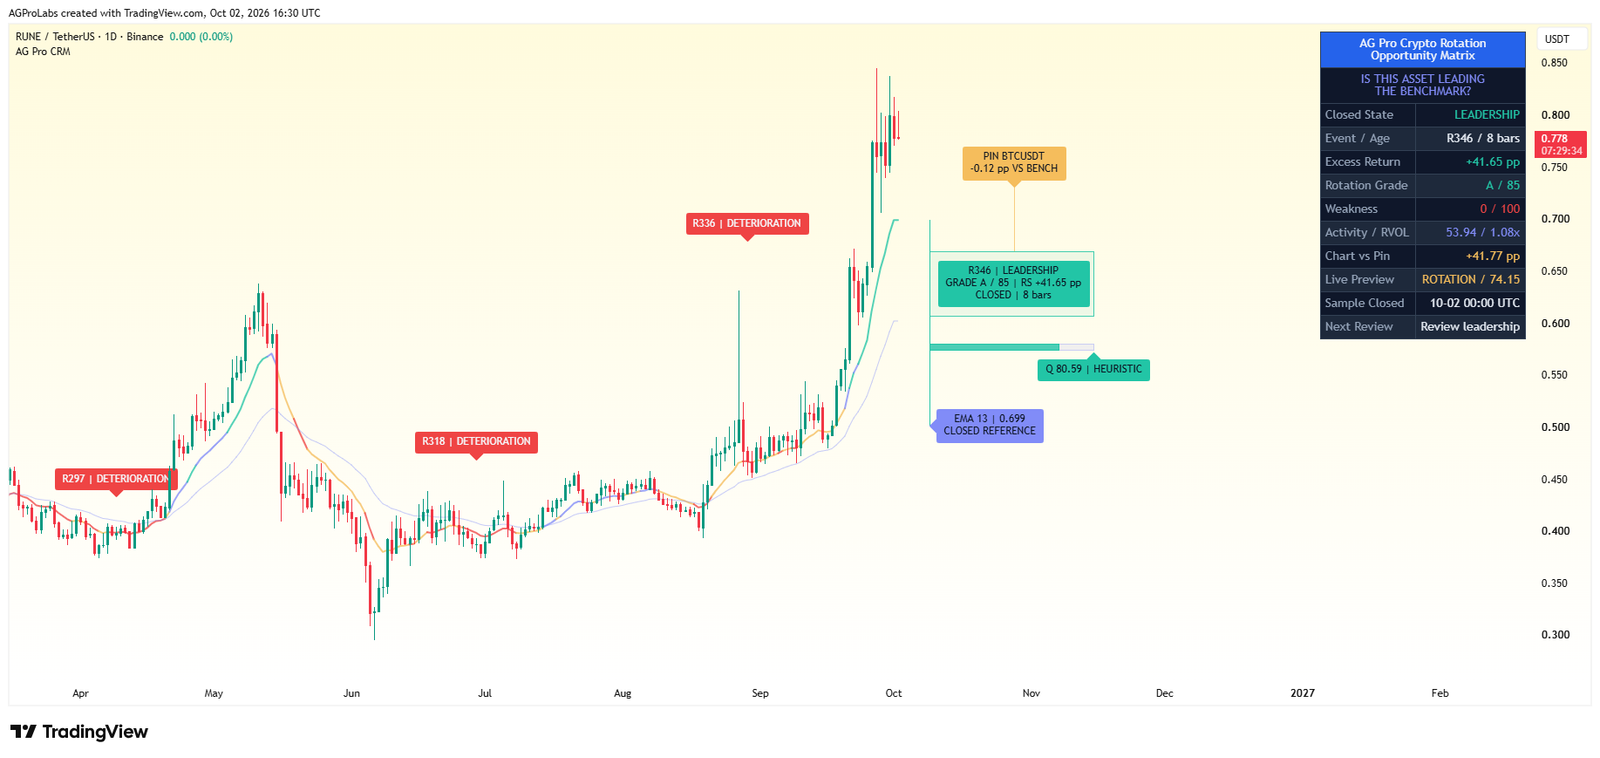
Controls chart annotation density. Clean keeps the active context shelf; Balanced adds a pinned reference and up to eight confirmed history labels; Rich retains up to sixteen. All script guides are solid.
Effect on the script
This controls the visibility, placement, extent or retained history of the documented visual element. It is part of the chart presentation layer.
When to adjust it
Change it when the active reference is hard to inspect or when historical annotations compete with current price action.
Interpretation and limits
Reducing visible history or hiding an element does not improve the underlying observations. A visual projection is not a price forecast.
Original input tooltip
Controls chart annotation density. Clean keeps the active context shelf; Balanced adds a pinned reference and up to eight confirmed history labels; Rich retains up to sixteen. All script guides are solid.
Show Readiness Meter
- Input type
bool- Source default
true- Available options
Not specified in source- Minimum
Not specified in source- Maximum
Not specified in source- Step
Not specified in source
What it controls
Shows closed setup quality as a heuristic meter beneath the context shelf. The score is not a probability, liquidity measure, or trade instruction.
Effect on the script
This controls the visibility, placement, extent or retained history of the documented visual element. It is part of the chart presentation layer.
When to adjust it
Change it when the active reference is hard to inspect or when historical annotations compete with current price action.
Interpretation and limits
Reducing visible history or hiding an element does not improve the underlying observations. A visual projection is not a price forecast.
Original input tooltip
Shows closed setup quality as a heuristic meter beneath the context shelf. The score is not a probability, liquidity measure, or trade instruction.
Minimum Label Score
- Input type
int- Source default
75- Available options
Not specified in source- Minimum
60- Maximum
95- Step
Not specified in source
What it controls
Hides historical labels below this score while keeping the active rotation workflow, panel, and alerts visible.
Effect on the script
This filters the labels drawn on the chart; the internal workflow, dashboard and alert logic remain active.
When to adjust it
Change it when the active reference is hard to inspect or when historical annotations compete with current price action.
Interpretation and limits
A missing lower-score label does not mean that its analytical context or alert conditions have been disabled.
Original input tooltip
Hides historical labels below this score while keeping the active rotation workflow, panel, and alerts visible.
Rotation Window Projection Bars
- Input type
int- Source default
52- Available options
Not specified in source- Minimum
18- Maximum
240- Step
Not specified in source
What it controls
Controls how far the active rotation window is projected to the right.
Effect on the script
This controls the visibility, placement, extent or retained history of the documented visual element. It is part of the chart presentation layer.
When to adjust it
Change it when the active reference is hard to inspect or when historical annotations compete with current price action.
Interpretation and limits
Reducing visible history or hiding an element does not improve the underlying observations. A visual projection is not a price forecast.
Original input tooltip
Controls how far the active rotation window is projected to the right.
State Label Cooldown
- Input type
int- Source default
55- Available options
Not specified in source- Minimum
50- Maximum
180- Step
Not specified in source
What it controls
Controls the minimum number of bars between historical rotation state labels.
Effect on the script
This controls the visibility, placement, extent or retained history of the documented visual element. It is part of the chart presentation layer.
When to adjust it
Change it when the active reference is hard to inspect or when historical annotations compete with current price action.
Interpretation and limits
Reducing visible history or hiding an element does not improve the underlying observations. A visual projection is not a price forecast.
Original input tooltip
Controls the minimum number of bars between historical rotation state labels.
Label Font Size
- Input type
string- Source default
"Normal"- Available options
["Small", "Normal", "Large"]- Minimum
Not specified in source- Maximum
Not specified in source- Step
Not specified in source
What it controls
Controls visible chart label size.
Effect on the script
This changes presentation and legibility of the relevant chart element, rather than the underlying analytical model.
When to adjust it
Change it when the chart background, screen size or other overlays make the current presentation difficult to read.
Interpretation and limits
A visual preference does not strengthen the measured setup or alter its uncertainty.
Original input tooltip
Controls visible chart label size.
Panel
5 inputsShow Panel
- Input type
bool- Source default
true- Available options
Not specified in source- Minimum
Not specified in source- Maximum
Not specified in source- Step
Not specified in source
What it controls
Shows or hides the AGPro workflow panel. Overview, Metrics and Data pages separate closed scores, live previews, optional pinned comparisons and data alignment. Compact wrapped columns preserve chart space.
Effect on the script
This controls the visibility, placement, extent or retained history of the documented visual element. It is part of the chart presentation layer.
When to adjust it
Change it when the active reference is hard to inspect or when historical annotations compete with current price action.
Interpretation and limits
Reducing visible history or hiding an element does not improve the underlying observations. A visual projection is not a price forecast.
Original input tooltip
Shows or hides the AGPro workflow panel. Overview, Metrics and Data pages separate closed scores, live previews, optional pinned comparisons and data alignment. Compact wrapped columns preserve chart space.
Panel Page
- Input type
string- Source default
"Overview"- Available options
["Overview", "Metrics", "Data"]- Minimum
Not specified in source- Maximum
Not specified in source- Step
Not specified in source
What it controls
Overview supports first-glance review. Metrics explains closed scores. Data shows source alignment and the comparison window.
Effect on the script
This selects which part of the existing analytical readout is visible in the dashboard. It does not create a different event engine.
When to adjust it
Use a compact or overview page for routine reading and the detailed pages when inspecting assumptions, observations or exclusions.
Interpretation and limits
Information hidden by a page choice can still matter. Check the evidence and model assumptions before relying on a headline score.
Original input tooltip
Overview supports first-glance review. Metrics explains closed scores. Data shows source alignment and the comparison window.
Panel Location
- Input type
string- Source default
"Top Right"- Available options
["Top Right", "Top Left", "Bottom Right", "Bottom Left"]- Minimum
Not specified in source- Maximum
Not specified in source- Step
Not specified in source
What it controls
Sets panel location within the Panel controls.
Effect on the script
This changes presentation and legibility of the relevant chart element, rather than the underlying analytical model.
When to adjust it
Change it when the chart background, screen size or other overlays make the current presentation difficult to read.
Interpretation and limits
A visual preference does not strengthen the measured setup or alter its uncertainty.
Panel Theme
- Input type
string- Source default
"Dark"- Available options
["Dark", "Light"]- Minimum
Not specified in source- Maximum
Not specified in source- Step
Not specified in source
What it controls
Sets panel theme within the Panel controls.
Effect on the script
This changes presentation and legibility of the relevant chart element, rather than the underlying analytical model.
When to adjust it
Change it when the chart background, screen size or other overlays make the current presentation difficult to read.
Interpretation and limits
A visual preference does not strengthen the measured setup or alter its uncertainty.
Panel Font Size
- Input type
string- Source default
"Normal"- Available options
["Small", "Normal", "Large"]- Minimum
Not specified in source- Maximum
Not specified in source- Step
Not specified in source
What it controls
Sets panel font size within the Panel controls.
Effect on the script
This changes presentation and legibility of the relevant chart element, rather than the underlying analytical model.
When to adjust it
Change it when the chart background, screen size or other overlays make the current presentation difficult to read.
Interpretation and limits
A visual preference does not strengthen the measured setup or alter its uncertainty.
Keep the settings in context
Change one analytical assumption at a time and compare the same instrument, timeframe and history. A chart reference, score, observation rate or input default does not establish a trade fill, a forward probability or a guaranteed outcome.
Return to the product overview · View this script on TradingView