Use your browser’s Find (Ctrl+F / ⌘F) to locate a setting. Open its row for the full explanation and limits. Source-check time is a verification timestamp, not a script publication date.
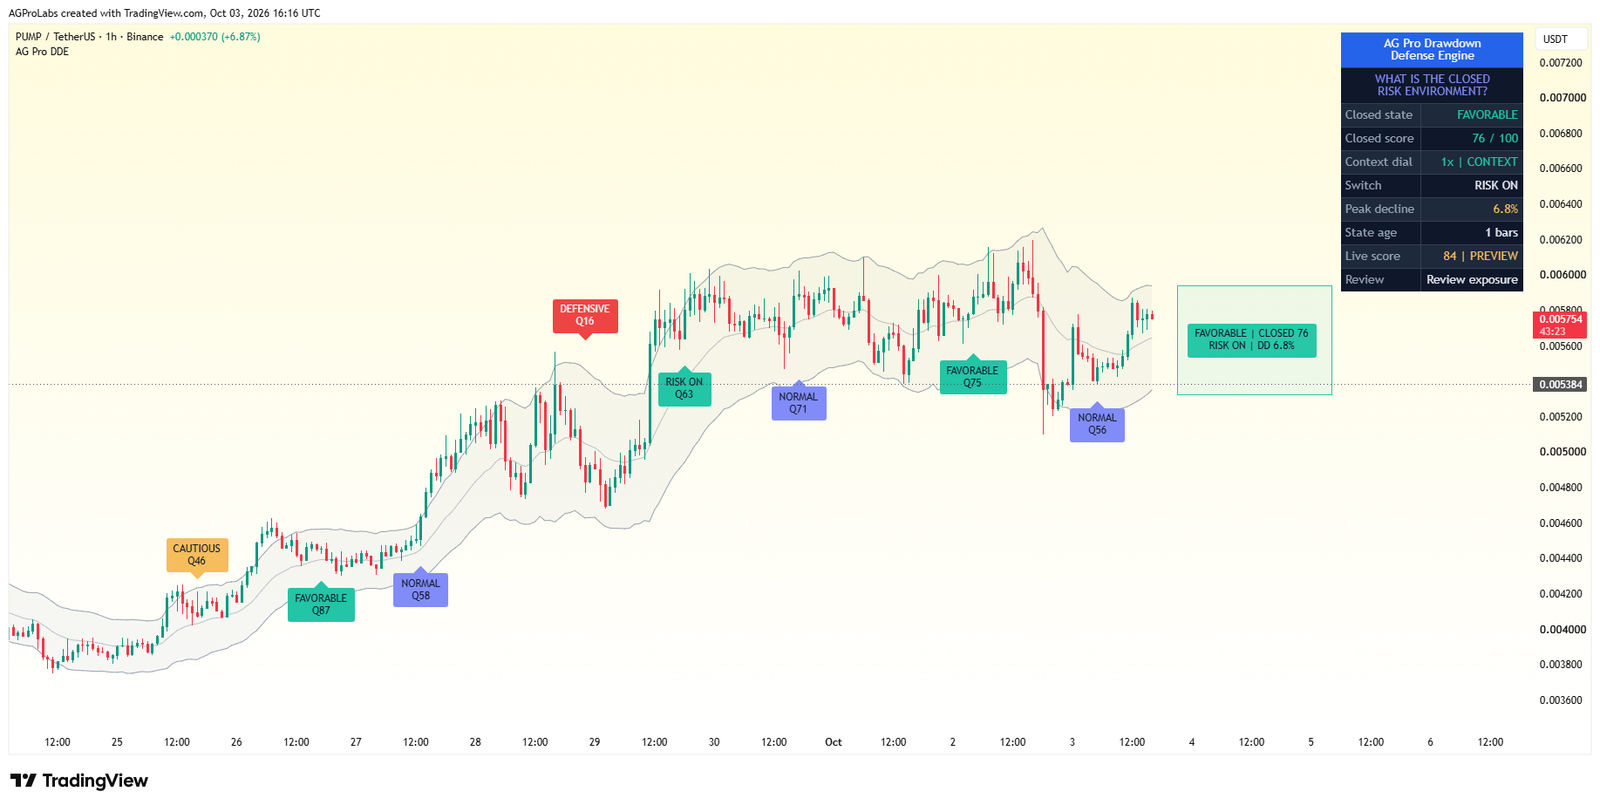
General & Display
10 inputsShow Panel
- Input type
bool- Source default
true- Available options
Not specified in source- Minimum
Not specified in source- Maximum
Not specified in source- Step
Not specified in source
What it controls
Toggle the on-chart risk dashboard. Enabled by default.
Effect on the script
This controls the visibility, placement, extent or retained history of the documented visual element. It is part of the chart presentation layer.
When to adjust it
Change it when the active reference is hard to inspect or when historical annotations compete with current price action.
Interpretation and limits
Reducing visible history or hiding an element does not improve the underlying observations. A visual projection is not a price forecast.
Original input tooltip
Toggle the on-chart risk dashboard. Enabled by default.
Panel Theme
- Input type
string- Source default
"Dark"- Available options
["Dark", "Light"]- Minimum
Not specified in source- Maximum
Not specified in source- Step
Not specified in source
What it controls
Choose contrast-safe panel colors independently of the chart theme.
Effect on the script
This changes presentation and legibility of the relevant chart element, rather than the underlying analytical model.
When to adjust it
Change it when the chart background, screen size or other overlays make the current presentation difficult to read.
Interpretation and limits
A visual preference does not strengthen the measured setup or alter its uncertainty.
Original input tooltip
Choose contrast-safe panel colors independently of the chart theme.
Panel Location
- Input type
string- Source default
"Top Right"- Available options
["Top Right", "Top Left", "Bottom Right", "Bottom Left", "Middle Right"]- Minimum
Not specified in source- Maximum
Not specified in source- Step
Not specified in source
What it controls
Anchor the compact dashboard to a chart corner or side.
Effect on the script
This changes presentation and legibility of the relevant chart element, rather than the underlying analytical model.
When to adjust it
Change it when the chart background, screen size or other overlays make the current presentation difficult to read.
Interpretation and limits
A visual preference does not strengthen the measured setup or alter its uncertainty.
Original input tooltip
Anchor the compact dashboard to a chart corner or side.
Panel Font Size
- Input type
string- Source default
"Normal"- Available options
["Small", "Normal", "Large"]- Minimum
Not specified in source- Maximum
Not specified in source- Step
Not specified in source
What it controls
Readable Normal default. Detailed metrics are separated into pages to preserve chart space.
Effect on the script
This changes presentation and legibility of the relevant chart element, rather than the underlying analytical model.
When to adjust it
Change it when the chart background, screen size or other overlays make the current presentation difficult to read.
Interpretation and limits
A visual preference does not strengthen the measured setup or alter its uncertainty.
Original input tooltip
Readable Normal default. Detailed metrics are separated into pages to preserve chart space.
Label Font Size
- Input type
string- Source default
"Normal"- Available options
["Small", "Normal", "Large"]- Minimum
Not specified in source- Maximum
Not specified in source- Step
Not specified in source
What it controls
Controls historical event badges and the centered state badge.
Effect on the script
This changes presentation and legibility of the relevant chart element, rather than the underlying analytical model.
When to adjust it
Change it when the chart background, screen size or other overlays make the current presentation difficult to read.
Interpretation and limits
A visual preference does not strengthen the measured setup or alter its uncertainty.
Original input tooltip
Controls historical event badges and the centered state badge.
Panel Page
- Input type
string- Source default
"Overview"- Available options
["Overview", "Factors", "Evidence"]- Minimum
Not specified in source- Maximum
Not specified in source- Step
Not specified in source
What it controls
Overview: closed state and live preview. Factors: four closed-bar components. Evidence: non-overlapping historical downside windows.
Effect on the script
This selects which part of the existing analytical readout is visible in the dashboard. It does not create a different event engine.
When to adjust it
Use a compact or overview page for routine reading and the detailed pages when inspecting assumptions, observations or exclusions.
Interpretation and limits
Information hidden by a page choice can still matter. Check the evidence and model assumptions before relying on a headline score.
Original input tooltip
Overview: closed state and live preview. Factors: four closed-bar components. Evidence: non-overlapping historical downside windows.
Show Risk Regime Background
- Input type
bool- Source default
false- Available options
Not specified in source- Minimum
Not specified in source- Maximum
Not specified in source- Step
Not specified in source
What it controls
Optionally tint the background by risk regime. Disabled by default so the volatility envelope and candles remain the primary chart story.
Effect on the script
This controls the visibility, placement, extent or retained history of the documented visual element. It is part of the chart presentation layer.
When to adjust it
Change it when the active reference is hard to inspect or when historical annotations compete with current price action.
Interpretation and limits
Reducing visible history or hiding an element does not improve the underlying observations. A visual projection is not a price forecast.
Original input tooltip
Optionally tint the background by risk regime. Disabled by default so the volatility envelope and candles remain the primary chart story.
Show Volatility Envelope
- Input type
bool- Source default
true- Available options
Not specified in source- Minimum
Not specified in source- Maximum
Not specified in source- Step
Not specified in source
What it controls
Draw an EMA-centered ATR envelope. The band width tracks volatility.
Effect on the script
This controls the visibility, placement, extent or retained history of the documented visual element. It is part of the chart presentation layer.
When to adjust it
Change it when the active reference is hard to inspect or when historical annotations compete with current price action.
Interpretation and limits
Reducing visible history or hiding an element does not improve the underlying observations. A visual projection is not a price forecast.
Original input tooltip
Draw an EMA-centered ATR envelope. The band width tracks volatility.
Show State Readout
- Input type
bool- Source default
true- Available options
Not specified in source- Minimum
Not specified in source- Maximum
Not specified in source- Step
Not specified in source
What it controls
Draw the last closed EMA/ATR band in future chart space with a centered state badge. The dial is a heuristic context scale, not a position-size recommendation.
Effect on the script
This controls the visibility, placement, extent or retained history of the documented visual element. It is part of the chart presentation layer.
When to adjust it
Change it when the active reference is hard to inspect or when historical annotations compete with current price action.
Interpretation and limits
Reducing visible history or hiding an element does not improve the underlying observations. A visual projection is not a price forecast.
Original input tooltip
Draw the last closed EMA/ATR band in future chart space with a centered state badge. The dial is a heuristic context scale, not a position-size recommendation.
Show Regime Markers
- Input type
bool- Source default
true- Available options
Not specified in source- Minimum
Not specified in source- Maximum
Not specified in source- Step
Not specified in source
What it controls
Show closed-bar hysteresis switches and confirmed regime changes. Visual spacing does not suppress alerts.
Effect on the script
This controls the visibility, placement, extent or retained history of the documented visual element. It is part of the chart presentation layer.
When to adjust it
Change it when the active reference is hard to inspect or when historical annotations compete with current price action.
Interpretation and limits
Reducing visible history or hiding an element does not improve the underlying observations. A visual projection is not a price forecast.
Original input tooltip
Show closed-bar hysteresis switches and confirmed regime changes. Visual spacing does not suppress alerts.
Risk Factors
7 inputsATR Length
- Input type
int- Source default
14- Available options
Not specified in source- Minimum
1- Maximum
Not specified in source- Step
Not specified in source
What it controls
ATR smoothing period used for volatility factors and the envelope.
Effect on the script
This changes the documented volatility, risk-distance or location reference used by the analytical workflow.
When to adjust it
Set the relevant risk or distance assumption as part of a coherent plan, then inspect the resulting geometry.
Interpretation and limits
A chart reference is not an account-risk limit, a live stop or a guarantee of execution. Gaps and changing volatility can exceed the reference.
Original input tooltip
ATR smoothing period used for volatility factors and the envelope.
Volatility Baseline Length
- Input type
int- Source default
50- Available options
Not specified in source- Minimum
2- Maximum
Not specified in source- Step
Not specified in source
What it controls
Window for the average ATR the current ATR is compared against.
Effect on the script
This changes the observation window or sensitivity of the named calculation feeding the workflow.
When to adjust it
Match the calculation horizon to the analytical question and keep it recorded when comparing results.
Interpretation and limits
Changing the window changes the historical context and can alter warm-up, states and observations. It does not validate a future edge.
Original input tooltip
Window for the average ATR the current ATR is compared against.
Volatility Trend Lookback
- Input type
int- Source default
10- Available options
Not specified in source- Minimum
2- Maximum
Not specified in source- Step
Not specified in source
What it controls
Bars back used to judge whether volatility is expanding or contracting.
Effect on the script
This changes the observation window or sensitivity of the named calculation feeding the workflow.
When to adjust it
Match the calculation horizon to the analytical question and keep it recorded when comparing results.
Interpretation and limits
Changing the window changes the historical context and can alter warm-up, states and observations. It does not validate a future edge.
Original input tooltip
Bars back used to judge whether volatility is expanding or contracting.
Trend Clarity Lookback
- Input type
int- Source default
20- Available options
Not specified in source- Minimum
2- Maximum
Not specified in source- Step
Not specified in source
What it controls
Window for the efficiency ratio: clean trend versus chop.
Effect on the script
This changes the observation window or sensitivity of the named calculation feeding the workflow.
When to adjust it
Match the calculation horizon to the analytical question and keep it recorded when comparing results.
Interpretation and limits
Changing the window changes the historical context and can alter warm-up, states and observations. It does not validate a future edge.
Original input tooltip
Window for the efficiency ratio: clean trend versus chop.
Drawdown Lookback
- Input type
int- Source default
50- Available options
Not specified in source- Minimum
2- Maximum
Not specified in source- Step
Not specified in source
What it controls
Rolling-high window used to measure drawdown from the recent peak.
Effect on the script
This changes the observation window or sensitivity of the named calculation feeding the workflow.
When to adjust it
Match the calculation horizon to the analytical question and keep it recorded when comparing results.
Interpretation and limits
Changing the window changes the historical context and can alter warm-up, states and observations. It does not validate a future edge.
Original input tooltip
Rolling-high window used to measure drawdown from the recent peak.
Envelope EMA Length
- Input type
int- Source default
20- Available options
Not specified in source- Minimum
2- Maximum
Not specified in source- Step
Not specified in source
What it controls
EMA period for the visual envelope center; it does not change the four-factor score.
Effect on the script
This changes the visual volatility envelope. The four-factor risk score uses its separately configured inputs.
When to adjust it
Change it when the active reference is hard to inspect or when historical annotations compete with current price action.
Interpretation and limits
Reducing visible history or hiding an element does not improve the underlying observations. A visual projection is not a price forecast.
Original input tooltip
EMA period for the visual envelope center; it does not change the four-factor score.
Envelope ATR Multiple
- Input type
float- Source default
2.0- Available options
Not specified in source- Minimum
0.1- Maximum
10.0- Step
0.1
What it controls
Visual envelope width in ATR units; it is not a forecast or stop level.
Effect on the script
This changes the visual volatility envelope. The four-factor risk score uses its separately configured inputs.
When to adjust it
Change it when the active reference is hard to inspect or when historical annotations compete with current price action.
Interpretation and limits
Reducing visible history or hiding an element does not improve the underlying observations. A visual projection is not a price forecast.
Original input tooltip
Visual envelope width in ATR units; it is not a forecast or stop level.
Thresholds
11 inputsVolatility Low Ratio
- Input type
float- Source default
0.9- Available options
Not specified in source- Minimum
0.1- Maximum
2.0- Step
0.05
What it controls
ATR / baseline at or below this scores fully favorable.
Effect on the script
This supplies the documented value to the associated analytical component.
When to adjust it
Change it when intentionally defining a different analytical assumption, keeping the other settings stable for comparison.
Interpretation and limits
A different configuration changes the model being reviewed; it does not promise a better trading outcome.
Original input tooltip
ATR / baseline at or below this scores fully favorable.
Volatility High Ratio
- Input type
float- Source default
1.4- Available options
Not specified in source- Minimum
0.5- Maximum
5.0- Step
0.05
What it controls
ATR / baseline at or above this scores fully hostile.
Effect on the script
This supplies the documented value to the associated analytical component.
When to adjust it
Change it when intentionally defining a different analytical assumption, keeping the other settings stable for comparison.
Interpretation and limits
A different configuration changes the model being reviewed; it does not promise a better trading outcome.
Original input tooltip
ATR / baseline at or above this scores fully hostile.
Clean Trend Efficiency
- Input type
float- Source default
0.5- Available options
Not specified in source- Minimum
0.1- Maximum
1.0- Step
0.05
What it controls
Efficiency ratio at or above this scores a clean trend.
Effect on the script
This supplies the documented value to the associated analytical component.
When to adjust it
Change it when intentionally defining a different analytical assumption, keeping the other settings stable for comparison.
Interpretation and limits
A different configuration changes the model being reviewed; it does not promise a better trading outcome.
Original input tooltip
Efficiency ratio at or above this scores a clean trend.
Choppy Efficiency
- Input type
float- Source default
0.25- Available options
Not specified in source- Minimum
0.0- Maximum
1.0- Step
0.05
What it controls
Efficiency ratio at or below this scores choppy.
Effect on the script
This supplies the documented value to the associated analytical component.
When to adjust it
Change it when intentionally defining a different analytical assumption, keeping the other settings stable for comparison.
Interpretation and limits
A different configuration changes the model being reviewed; it does not promise a better trading outcome.
Original input tooltip
Efficiency ratio at or below this scores choppy.
Shallow Drawdown %
- Input type
float- Source default
5.0- Available options
Not specified in source- Minimum
0.0- Maximum
50.0- Step
0.5
What it controls
Drawdown from the recent high at or below this scores favorable.
Effect on the script
This supplies the documented value to the associated analytical component.
When to adjust it
Change it when intentionally defining a different analytical assumption, keeping the other settings stable for comparison.
Interpretation and limits
A different configuration changes the model being reviewed; it does not promise a better trading outcome.
Original input tooltip
Drawdown from the recent high at or below this scores favorable.
Deep Drawdown %
- Input type
float- Source default
20.0- Available options
Not specified in source- Minimum
1.0- Maximum
90.0- Step
0.5
What it controls
Drawdown from the recent high at or above this scores hostile.
Effect on the script
This supplies the documented value to the associated analytical component.
When to adjust it
Change it when intentionally defining a different analytical assumption, keeping the other settings stable for comparison.
Interpretation and limits
A different configuration changes the model being reviewed; it does not promise a better trading outcome.
Original input tooltip
Drawdown from the recent high at or above this scores hostile.
Favorable Score
- Input type
int- Source default
75- Available options
Not specified in source- Minimum
50- Maximum
100- Step
Not specified in source
What it controls
Minimum score for a favorable candidate. Must exceed the Normal threshold.
Effect on the script
This changes the boundary for the named score classification or qualification gate.
When to adjust it
Specify how strict that classification should be before reviewing the resulting states and samples.
Interpretation and limits
Changing a threshold changes what qualifies. It does not improve the underlying market conditions or establish a success probability.
Original input tooltip
Minimum score for a favorable candidate. Must exceed the Normal threshold.
Normal Score
- Input type
int- Source default
50- Available options
Not specified in source- Minimum
25- Maximum
99- Step
Not specified in source
What it controls
Normal candidate boundary and center of the hysteresis switch. Must lie between Cautious and Favorable.
Effect on the script
This changes the boundary for the named score classification or qualification gate.
When to adjust it
Specify how strict that classification should be before reviewing the resulting states and samples.
Interpretation and limits
Changing a threshold changes what qualifies. It does not improve the underlying market conditions or establish a success probability.
Original input tooltip
Normal candidate boundary and center of the hysteresis switch. Must lie between Cautious and Favorable.
Cautious Score
- Input type
int- Source default
25- Available options
Not specified in source- Minimum
1- Maximum
74- Step
Not specified in source
What it controls
Minimum score for a cautious candidate. Scores below this form a defensive candidate.
Effect on the script
This changes the boundary for the named score classification or qualification gate.
When to adjust it
Specify how strict that classification should be before reviewing the resulting states and samples.
Interpretation and limits
Changing a threshold changes what qualifies. It does not improve the underlying market conditions or establish a success probability.
Original input tooltip
Minimum score for a cautious candidate. Scores below this form a defensive candidate.
State Confirm Bars
- Input type
int- Source default
2- Available options
Not specified in source- Minimum
1- Maximum
20- Step
Not specified in source
What it controls
Bars a new regime must hold before it is committed. Filters flicker.
Effect on the script
This controls the documented persistence, spacing or re-arming requirement for an analytical state or event.
When to adjust it
Choose the stability or spacing requirement before assessing repeated events.
Interpretation and limits
Greater persistence or spacing can delay or suppress events. It does not remove uncertainty or make a retained state permanently valid.
Original input tooltip
Bars a new regime must hold before it is committed. Filters flicker.
Regime Hysteresis
- Input type
int- Source default
10- Available options
Not specified in source- Minimum
0- Maximum
40- Step
Not specified in source
What it controls
Score buffer around the Normal boundary before a Risk On/Off shift is confirmed.
Effect on the script
This controls the documented persistence, spacing or re-arming requirement for an analytical state or event.
When to adjust it
Choose the stability or spacing requirement before assessing repeated events.
Interpretation and limits
Greater persistence or spacing can delay or suppress events. It does not remove uncertainty or make a retained state permanently valid.
Original input tooltip
Score buffer around the Normal boundary before a Risk On/Off shift is confirmed.
Risk References & Observations
2 inputsATR Reference Multiple
- Input type
float- Source default
1.5- Available options
Not specified in source- Minimum
0.1- Maximum
10.0- Step
0.1
What it controls
Analytical ATR distance reference for the current volatility. It is not a trade instruction or account-specific stop.
Effect on the script
This changes the documented volatility, risk-distance or location reference used by the analytical workflow.
When to adjust it
Set the relevant risk or distance assumption as part of a coherent plan, then inspect the resulting geometry.
Interpretation and limits
A chart reference is not an account-risk limit, a live stop or a guarantee of execution. Gaps and changing volatility can exceed the reference.
Original input tooltip
Analytical ATR distance reference for the current volatility. It is not a trade instruction or account-specific stop.
Forward Risk Horizon (Bars)
- Input type
int- Source default
20- Available options
Not specified in source- Minimum
5- Maximum
200- Step
Not specified in source
What it controls
Number of subsequent bars in each non-overlapping observation. Measures maximum downside from the observation close, not peak-to-trough account drawdown. Changing the horizon resets the historical sample.
Effect on the script
This sets the documented age, waiting period or forward observation deadline used by the event lifecycle.
When to adjust it
Match the review horizon to the question being studied and keep the deadline explicit in historical comparisons.
Interpretation and limits
Changing a deadline changes which observations resolve, expire or remain eligible. A timed model observation is not a broker trade.
Original input tooltip
Number of subsequent bars in each non-overlapping observation. Measures maximum downside from the observation close, not peak-to-trough account drawdown. Changing the horizon resets the historical sample.
Labels
4 inputsLabel Offset (ATR)
- Input type
float- Source default
0.35- Available options
Not specified in source- Minimum
0.0- Maximum
1.0- Step
0.05
What it controls
Small ATR clearance outside nearby wicks. Recent marker positions can adjust as neighboring candles close; event timing does not move.
Effect on the script
This controls the visibility, placement, extent or retained history of the documented visual element. It is part of the chart presentation layer.
When to adjust it
Change it when the active reference is hard to inspect or when historical annotations compete with current price action.
Interpretation and limits
Reducing visible history or hiding an element does not improve the underlying observations. A visual projection is not a price forecast.
Original input tooltip
Small ATR clearance outside nearby wicks. Recent marker positions can adjust as neighboring candles close; event timing does not move.
Level Forward Bars
- Input type
int- Source default
32- Available options
Not specified in source- Minimum
12- Maximum
100- Step
Not specified in source
What it controls
Projection length for the last closed envelope snapshot. Bounded to remain within chart drawing limits.
Effect on the script
This controls the visibility, placement, extent or retained history of the documented visual element. It is part of the chart presentation layer.
When to adjust it
Change it when the active reference is hard to inspect or when historical annotations compete with current price action.
Interpretation and limits
Reducing visible history or hiding an element does not improve the underlying observations. A visual projection is not a price forecast.
Original input tooltip
Projection length for the last closed envelope snapshot. Bounded to remain within chart drawing limits.
Max Markers
- Input type
int- Source default
8- Available options
Not specified in source- Minimum
4- Maximum
60- Step
Not specified in source
What it controls
Maximum retained historical event labels. Older labels are removed, not the underlying observations.
Effect on the script
This controls the visibility, placement, extent or retained history of the documented visual element. It is part of the chart presentation layer.
When to adjust it
Change it when the active reference is hard to inspect or when historical annotations compete with current price action.
Interpretation and limits
Reducing visible history or hiding an element does not improve the underlying observations. A visual projection is not a price forecast.
Original input tooltip
Maximum retained historical event labels. Older labels are removed, not the underlying observations.
Min Bars Between Markers
- Input type
int- Source default
20- Available options
Not specified in source- Minimum
0- Maximum
200- Step
Not specified in source
What it controls
Minimum bars between visible Risk On / Risk Off events. Prevents regime markers from clustering in the same chart area.
Effect on the script
This controls the visibility, placement, extent or retained history of the documented visual element. It is part of the chart presentation layer.
When to adjust it
Change it when the active reference is hard to inspect or when historical annotations compete with current price action.
Interpretation and limits
Reducing visible history or hiding an element does not improve the underlying observations. A visual projection is not a price forecast.
Original input tooltip
Minimum bars between visible Risk On / Risk Off events. Prevents regime markers from clustering in the same chart area.
Keep the settings in context
Change one analytical assumption at a time and compare the same instrument, timeframe and history. A chart reference, score, observation rate or input default does not establish a trade fill, a forward probability or a guaranteed outcome.
Return to the product overview · View this script on TradingView