Use your browser’s Find (Ctrl+F / ⌘F) to locate a setting. Open its row for the full explanation and limits. Source-check time is a verification timestamp, not a script publication date.
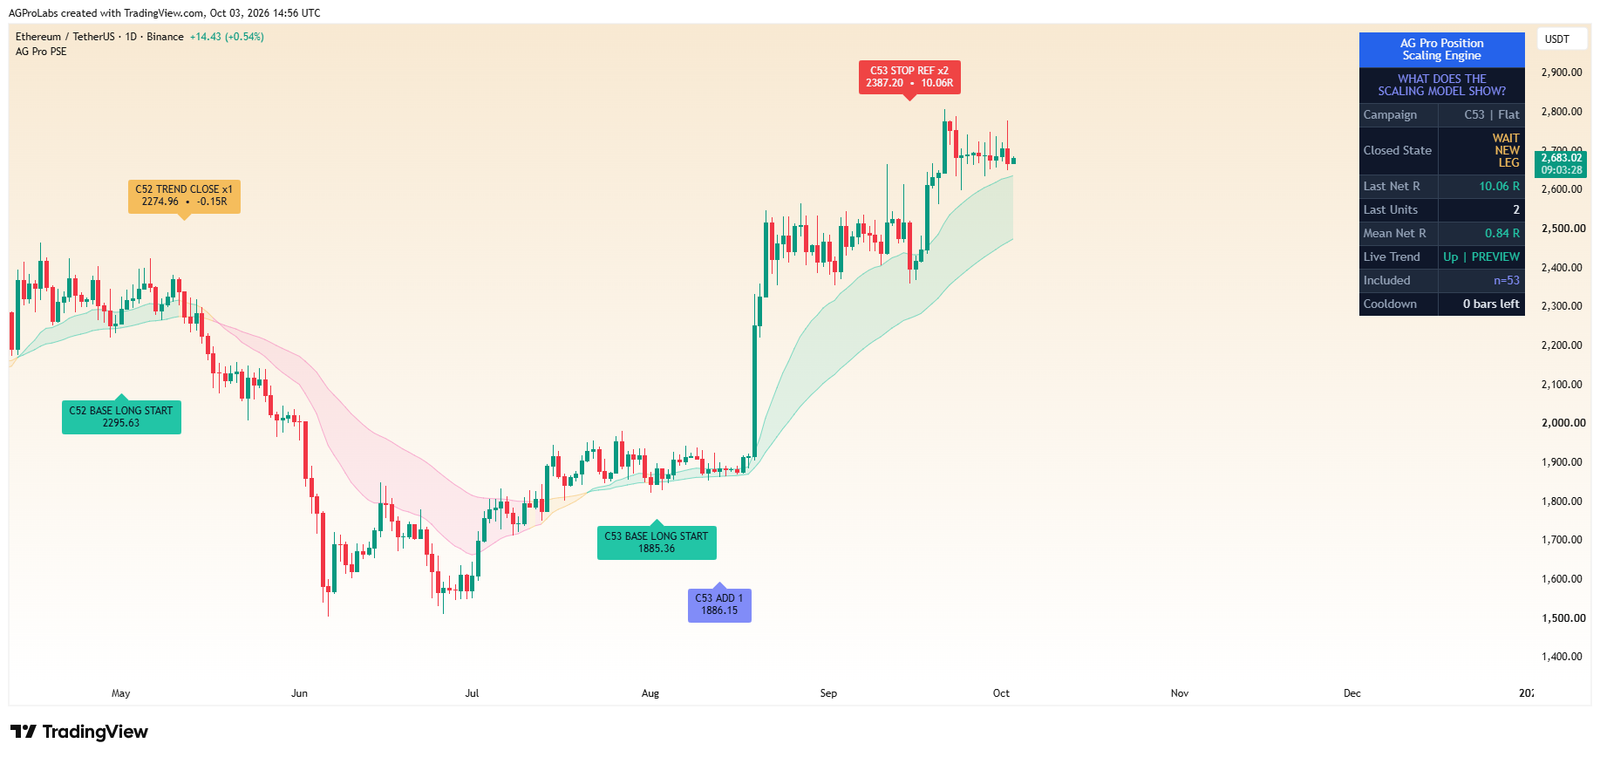
General & Display
11 inputsShow Panel
- Input type
bool- Source default
true- Available options
Not specified in source- Minimum
Not specified in source- Maximum
Not specified in source- Step
Not specified in source
What it controls
Toggle the on-chart scaling dashboard. Enabled by default.
Effect on the script
This controls the visibility, placement, extent or retained history of the documented visual element. It is part of the chart presentation layer.
When to adjust it
Change it when the active reference is hard to inspect or when historical annotations compete with current price action.
Interpretation and limits
Reducing visible history or hiding an element does not improve the underlying observations. A visual projection is not a price forecast.
Original input tooltip
Toggle the on-chart scaling dashboard. Enabled by default.
Panel Theme
- Input type
string- Source default
"Dark"- Available options
["Dark", "Light"]- Minimum
Not specified in source- Maximum
Not specified in source- Step
Not specified in source
What it controls
Visual theme for the panel background and text.
Effect on the script
This changes presentation and legibility of the relevant chart element, rather than the underlying analytical model.
When to adjust it
Change it when the chart background, screen size or other overlays make the current presentation difficult to read.
Interpretation and limits
A visual preference does not strengthen the measured setup or alter its uncertainty.
Original input tooltip
Visual theme for the panel background and text.
Panel Location
- Input type
string- Source default
"Top Right"- Available options
["Top Right", "Top Left", "Bottom Right", "Bottom Left", "Middle Right"]- Minimum
Not specified in source- Maximum
Not specified in source- Step
Not specified in source
What it controls
Control panel location or readable annotation size. Normal is the default font size.
Effect on the script
This changes presentation and legibility of the relevant chart element, rather than the underlying analytical model.
When to adjust it
Change it when the chart background, screen size or other overlays make the current presentation difficult to read.
Interpretation and limits
A visual preference does not strengthen the measured setup or alter its uncertainty.
Original input tooltip
Control panel location or readable annotation size. Normal is the default font size.
Panel Font Size
- Input type
string- Source default
"Normal"- Available options
["Small", "Normal", "Large"]- Minimum
Not specified in source- Maximum
Not specified in source- Step
Not specified in source
What it controls
Control panel location or readable annotation size. Normal is the default font size.
Effect on the script
This changes presentation and legibility of the relevant chart element, rather than the underlying analytical model.
When to adjust it
Change it when the chart background, screen size or other overlays make the current presentation difficult to read.
Interpretation and limits
A visual preference does not strengthen the measured setup or alter its uncertainty.
Original input tooltip
Control panel location or readable annotation size. Normal is the default font size.
Label Font Size
- Input type
string- Source default
"Normal"- Available options
["Small", "Normal", "Large"]- Minimum
Not specified in source- Maximum
Not specified in source- Step
Not specified in source
What it controls
Control panel location or readable annotation size. Normal is the default font size.
Effect on the script
This changes presentation and legibility of the relevant chart element, rather than the underlying analytical model.
When to adjust it
Change it when the chart background, screen size or other overlays make the current presentation difficult to read.
Interpretation and limits
A visual preference does not strengthen the measured setup or alter its uncertainty.
Original input tooltip
Control panel location or readable annotation size. Normal is the default font size.
Panel Page
- Input type
string- Source default
"Overview"- Available options
["Overview", "Risk", "References", "Evidence"]- Minimum
Not specified in source- Maximum
Not specified in source- Step
Not specified in source
What it controls
Separate confirmed context, aggregate risk, exact references and historical outcomes without widening the panel.
Effect on the script
This selects which part of the existing analytical readout is visible in the dashboard. It does not create a different event engine.
When to adjust it
Use a compact or overview page for routine reading and the detailed pages when inspecting assumptions, observations or exclusions.
Interpretation and limits
Information hidden by a page choice can still matter. Check the evidence and model assumptions before relying on a headline score.
Original input tooltip
Separate confirmed context, aggregate risk, exact references and historical outcomes without widening the panel.
Show Trend Ribbon
- Input type
bool- Source default
true- Available options
Not specified in source- Minimum
Not specified in source- Maximum
Not specified in source- Step
Not specified in source
What it controls
Fill the zone between the fast and slow EMA, colored by trend direction.
Effect on the script
This controls the visibility, placement, extent or retained history of the documented visual element. It is part of the chart presentation layer.
When to adjust it
Change it when the active reference is hard to inspect or when historical annotations compete with current price action.
Interpretation and limits
Reducing visible history or hiding an element does not improve the underlying observations. A visual projection is not a price forecast.
Original input tooltip
Fill the zone between the fast and slow EMA, colored by trend direction.
Show Position Highlight
- Input type
bool- Source default
false- Available options
Not specified in source- Minimum
Not specified in source- Maximum
Not specified in source- Step
Not specified in source
What it controls
Optionally shade the background while a position is open. Disabled by default for a cleaner publication view.
Effect on the script
This controls the visibility, placement, extent or retained history of the documented visual element. It is part of the chart presentation layer.
When to adjust it
Change it when the active reference is hard to inspect or when historical annotations compete with current price action.
Interpretation and limits
Reducing visible history or hiding an element does not improve the underlying observations. A visual projection is not a price forecast.
Original input tooltip
Optionally shade the background while a position is open. Disabled by default for a cleaner publication view.
Show Add-On Zone
- Input type
bool- Source default
true- Available options
Not specified in source- Minimum
Not specified in source- Maximum
Not specified in source- Step
Not specified in source
What it controls
Draw the projected add-on zone with a centered quality label while a position is open.
Effect on the script
This controls the visibility, placement, extent or retained history of the documented visual element. It is part of the chart presentation layer.
When to adjust it
Change it when the active reference is hard to inspect or when historical annotations compete with current price action.
Interpretation and limits
Reducing visible history or hiding an element does not improve the underlying observations. A visual projection is not a price forecast.
Original input tooltip
Draw the projected add-on zone with a centered quality label while a position is open.
Show Entry / Add Markers
- Input type
bool- Source default
true- Available options
Not specified in source- Minimum
Not specified in source- Maximum
Not specified in source- Step
Not specified in source
What it controls
Mark the base entry, each add and the exit on the chart.
Effect on the script
This controls the visibility, placement, extent or retained history of the documented visual element. It is part of the chart presentation layer.
When to adjust it
Change it when the active reference is hard to inspect or when historical annotations compete with current price action.
Interpretation and limits
Reducing visible history or hiding an element does not improve the underlying observations. A visual projection is not a price forecast.
Original input tooltip
Mark the base entry, each add and the exit on the chart.
Show Blended / Stop Levels
- Input type
bool- Source default
true- Available options
Not specified in source- Minimum
Not specified in source- Maximum
Not specified in source- Step
Not specified in source
What it controls
Draw the blended entry and position stop lines.
Effect on the script
This controls the visibility, placement, extent or retained history of the documented visual element. It is part of the chart presentation layer.
When to adjust it
Change it when the active reference is hard to inspect or when historical annotations compete with current price action.
Interpretation and limits
Reducing visible history or hiding an element does not improve the underlying observations. A visual projection is not a price forecast.
Original input tooltip
Draw the blended entry and position stop lines.
Trend Module
4 inputsFast EMA Length
- Input type
int- Source default
20- Available options
Not specified in source- Minimum
2- Maximum
Not specified in source- Step
Not specified in source
What it controls
Short-term trend and the pullback reference for adds.
Effect on the script
This changes the observation window or sensitivity of the named calculation feeding the workflow.
When to adjust it
Match the calculation horizon to the analytical question and keep it recorded when comparing results.
Interpretation and limits
Changing the window changes the historical context and can alter warm-up, states and observations. It does not validate a future edge.
Original input tooltip
Short-term trend and the pullback reference for adds.
Slow EMA Length
- Input type
int- Source default
50- Available options
Not specified in source- Minimum
3- Maximum
Not specified in source- Step
Not specified in source
What it controls
Dominant trend the position is built with.
Effect on the script
This changes the observation window or sensitivity of the named calculation feeding the workflow.
When to adjust it
Match the calculation horizon to the analytical question and keep it recorded when comparing results.
Interpretation and limits
Changing the window changes the historical context and can alter warm-up, states and observations. It does not validate a future edge.
Original input tooltip
Dominant trend the position is built with.
Min Trend Slope %
- Input type
float- Source default
0.03- Available options
Not specified in source- Minimum
0.0- Maximum
5.0- Step
0.01
What it controls
Minimum slow-EMA slope required for a valid trend. Filters out flat markets.
Effect on the script
This changes the observation window or sensitivity of the named calculation feeding the workflow.
When to adjust it
Match the calculation horizon to the analytical question and keep it recorded when comparing results.
Interpretation and limits
Changing the window changes the historical context and can alter warm-up, states and observations. It does not validate a future edge.
Original input tooltip
Minimum slow-EMA slope required for a valid trend. Filters out flat markets.
Slope Window
- Input type
int- Source default
10- Available options
Not specified in source- Minimum
2- Maximum
Not specified in source- Step
Not specified in source
What it controls
Completed-bar span used to measure slow EMA percentage slope.
Effect on the script
This changes the observation window or sensitivity of the named calculation feeding the workflow.
When to adjust it
Match the calculation horizon to the analytical question and keep it recorded when comparing results.
Interpretation and limits
Changing the window changes the historical context and can alter warm-up, states and observations. It does not validate a future edge.
Original input tooltip
Completed-bar span used to measure slow EMA percentage slope.
Scaling Model
7 inputsMax Add-Ons
- Input type
int- Source default
3- Available options
Not specified in source- Minimum
1- Maximum
10- Step
Not specified in source
What it controls
Maximum number of additional entries on top of the base entry. Each unit is modeled as one equal-size position unit.
Effect on the script
This supplies the documented value to the associated analytical component.
When to adjust it
Change it when intentionally defining a different analytical assumption, keeping the other settings stable for comparison.
Interpretation and limits
A different configuration changes the model being reviewed; it does not promise a better trading outcome.
Original input tooltip
Maximum number of additional entries on top of the base entry. Each unit is modeled as one equal-size position unit.
Min Bars Between Adds
- Input type
int- Source default
8- Available options
Not specified in source- Minimum
1- Maximum
Not specified in source- Step
Not specified in source
What it controls
Minimum bars between consecutive add-ons.
Effect on the script
This controls the documented persistence, spacing or re-arming requirement for an analytical state or event.
When to adjust it
Choose the stability or spacing requirement before assessing repeated events.
Interpretation and limits
Greater persistence or spacing can delay or suppress events. It does not remove uncertainty or make a retained state permanently valid.
Original input tooltip
Minimum bars between consecutive add-ons.
Cooldown After Exit (Bars)
- Input type
int- Source default
8- Available options
Not specified in source- Minimum
0- Maximum
Not specified in source- Step
Not specified in source
What it controls
Minimum bars to wait after a position closes before a new base entry can open. Reduces whipsaw re-entries and keeps the chart clean.
Effect on the script
This controls the documented persistence, spacing or re-arming requirement for an analytical state or event.
When to adjust it
Choose the stability or spacing requirement before assessing repeated events.
Interpretation and limits
Greater persistence or spacing can delay or suppress events. It does not remove uncertainty or make a retained state permanently valid.
Original input tooltip
Minimum bars to wait after a position closes before a new base entry can open. Reduces whipsaw re-entries and keeps the chart clean.
Only Add In Profit
- Input type
bool- Source default
true- Available options
Not specified in source- Minimum
Not specified in source- Maximum
Not specified in source- Step
Not specified in source
What it controls
Only add when price is beyond the blended entry - the disciplined 'add to winners' rule.
Effect on the script
This enables or disables the documented factor or qualification requirement in the workflow.
When to adjust it
Choose whether the condition belongs in your defined checklist before evaluating the resulting states.
Interpretation and limits
Disabling a disagreeing factor changes the model rather than resolving the disagreement.
Original input tooltip
Only add when price is beyond the blended entry - the disciplined 'add to winners' rule.
Enforce Add Risk Budget
- Input type
bool- Source default
true- Available options
Not specified in source- Minimum
Not specified in source- Maximum
Not specified in source- Step
Not specified in source
What it controls
Block an otherwise qualified close-of-bar add when aggregate modeled loss at the prospective next-bar stop exceeds the budget. This is not a portfolio exposure limit or a guaranteed maximum loss.
Effect on the script
This enables the prospective aggregate modeled-loss gate for an otherwise qualified addition.
When to adjust it
Choose whether the documented add-risk budget should be a mandatory gate before reviewing a scaling sequence.
Interpretation and limits
The gate is based on modeled equal-size units and a reference stop. It is not a portfolio exposure limit or a guaranteed maximum loss.
Original input tooltip
Block an otherwise qualified close-of-bar add when aggregate modeled loss at the prospective next-bar stop exceeds the budget. This is not a portfolio exposure limit or a guaranteed maximum loss.
Add Risk Budget (Base R)
- Input type
float- Source default
3.0- Available options
Not specified in source- Minimum
1.0- Maximum
20.0- Step
0.25
What it controls
Maximum prospective modeled loss across all equal-size units, divided by the base unit's original ATR risk distance. Gaps can exceed this reference budget.
Effect on the script
This sets the maximum prospective modeled loss in original base-risk units when the add-risk gate is enabled.
When to adjust it
Change it only as part of a defined scaling model, then review the whole campaign rather than one add marker.
Interpretation and limits
Gaps and real execution can exceed the reference budget; it does not read account equity or other positions.
Original input tooltip
Maximum prospective modeled loss across all equal-size units, divided by the base unit's original ATR risk distance. Gaps can exceed this reference budget.
Round-Trip Cost Estimate (bps)
- Input type
float- Source default
0.0- Available options
Not specified in source- Minimum
0.0- Maximum
500.0- Step
1.0
What it controls
Estimated total round-trip cost per unit, based on its entry notional. Ten basis points equals 0.1%. Deducted once from campaign R and included in the add risk check. Excludes actual funding, changing spreads and broker fills.
Effect on the script
This adds the configured notional-based cost approximation to the model. It changes the model result or budget check that uses the estimate.
When to adjust it
Use it to examine an explicit cost assumption; record the basis-point value alongside the resulting model statistics.
Interpretation and limits
A constant estimate does not reproduce funding, variable spreads, actual commissions, slippage or broker fills.
Original input tooltip
Estimated total round-trip cost per unit, based on its entry notional. Ten basis points equals 0.1%. Deducted once from campaign R and included in the add risk check. Excludes actual funding, changing spreads and broker fills.
Trade Model
3 inputsATR Length
- Input type
int- Source default
14- Available options
Not specified in source- Minimum
1- Maximum
Not specified in source- Step
Not specified in source
What it controls
ATR calculation length for initial base risk, trailing buffer and visual offsets.
Effect on the script
This changes the documented volatility, risk-distance or location reference used by the analytical workflow.
When to adjust it
Set the relevant risk or distance assumption as part of a coherent plan, then inspect the resulting geometry.
Interpretation and limits
A chart reference is not an account-risk limit, a live stop or a guarantee of execution. Gaps and changing volatility can exceed the reference.
Original input tooltip
ATR calculation length for initial base risk, trailing buffer and visual offsets.
Initial Stop Distance (ATR)
- Input type
float- Source default
1.5- Available options
Not specified in source- Minimum
0.1- Maximum
10.0- Step
0.1
What it controls
Initial stop distance from the confirmed base-entry close, in ATR multiples. This fixed base-unit distance defines 1R for the full campaign.
Effect on the script
This changes the documented volatility, risk-distance or location reference used by the analytical workflow.
When to adjust it
Set the relevant risk or distance assumption as part of a coherent plan, then inspect the resulting geometry.
Interpretation and limits
A chart reference is not an account-risk limit, a live stop or a guarantee of execution. Gaps and changing volatility can exceed the reference.
Original input tooltip
Initial stop distance from the confirmed base-entry close, in ATR multiples. This fixed base-unit distance defines 1R for the full campaign.
Trail Swing Lookback
- Input type
int- Source default
10- Available options
Not specified in source- Minimum
2- Maximum
Not specified in source- Step
Not specified in source
What it controls
Recent swing window used to trail the position stop.
Effect on the script
This changes the swing or structural reference used by the documented detection or risk-reference calculation.
When to adjust it
Match the swing scale to the structure you intend to inspect, then review the resulting anchors and confirmation timing.
Interpretation and limits
Confirmed pivots require subsequent bars. Different settings create different structure and can change later events and observations.
Original input tooltip
Recent swing window used to trail the position stop.
Labels
3 inputsLabel Offset (ATR)
- Input type
float- Source default
1.0- Available options
Not specified in source- Minimum
0.0- Maximum
5.0- Step
0.1
What it controls
Vertical distance markers are placed above / below the candles, in ATR multiples. Keeps labels clear of price.
Effect on the script
This controls the visibility, placement, extent or retained history of the documented visual element. It is part of the chart presentation layer.
When to adjust it
Change it when the active reference is hard to inspect or when historical annotations compete with current price action.
Interpretation and limits
Reducing visible history or hiding an element does not improve the underlying observations. A visual projection is not a price forecast.
Original input tooltip
Vertical distance markers are placed above / below the candles, in ATR multiples. Keeps labels clear of price.
Level Forward Bars
- Input type
int- Source default
32- Available options
Not specified in source- Minimum
12- Maximum
120- Step
Not specified in source
What it controls
Forward shelf length, bounded below Pine drawing limits. Leave sufficient chart space to the right of price.
Effect on the script
This controls the visibility, placement, extent or retained history of the documented visual element. It is part of the chart presentation layer.
When to adjust it
Change it when the active reference is hard to inspect or when historical annotations compete with current price action.
Interpretation and limits
Reducing visible history or hiding an element does not improve the underlying observations. A visual projection is not a price forecast.
Original input tooltip
Forward shelf length, bounded below Pine drawing limits. Leave sufficient chart space to the right of price.
Max Trade Markers
- Input type
int- Source default
12- Available options
Not specified in source- Minimum
4- Maximum
60- Step
Not specified in source
What it controls
Maximum number of recent entry / add / exit markers kept on the chart. Older markers are removed automatically for a clean, premium view.
Effect on the script
This controls the visibility, placement, extent or retained history of the documented visual element. It is part of the chart presentation layer.
When to adjust it
Change it when the active reference is hard to inspect or when historical annotations compete with current price action.
Interpretation and limits
Reducing visible history or hiding an element does not improve the underlying observations. A visual projection is not a price forecast.
Original input tooltip
Maximum number of recent entry / add / exit markers kept on the chart. Older markers are removed automatically for a clean, premium view.
Keep the settings in context
Change one analytical assumption at a time and compare the same instrument, timeframe and history. A chart reference, score, observation rate or input default does not establish a trade fill, a forward probability or a guaranteed outcome.
Return to the product overview · View this script on TradingView