Use your browser’s Find (Ctrl+F / ⌘F) to locate a setting. Open its row for the full explanation and limits. Source-check time is a verification timestamp, not a script publication date.
⚙️ Edge Engine
6 inputsEdge Mode
- Input type
string- Source default
"Auto"- Available options
["Auto", "Hour of Day", "Day of Week", "Month of Year"]- Minimum
Not specified in source- Maximum
Not specified in source- Step
Not specified in source
What it controls
Auto selects the most relevant window for the chart timeframe: 1m–1h → Hour of Day, 2h–1D → Day of Week, 1W and above → Month of Year. You can also force a specific mode.
Effect on the script
This selects the hourly, weekday or monthly grouping used for seasonal observations, or its documented automatic choice.
When to adjust it
Select the calendar resolution that answers the timing question being studied.
Interpretation and limits
Results from different bucket resolutions are not interchangeable; examine sample counts and timezone as well.
Original input tooltip
Auto selects the most relevant window for the chart timeframe: 1m–1h → Hour of Day, 2h–1D → Day of Week, 1W and above → Month of Year. You can also force a specific mode.
Timezone
- Input type
string- Source default
"exchange"- Available options
["exchange", "UTC", "America/New_York", "Europe/London", "Asia/Tokyo", "Europe/Istanbul"]- Minimum
Not specified in source- Maximum
Not specified in source- Step
Not specified in source
What it controls
Timezone used to assign each bar to its clock window. 'exchange' uses the symbol's native exchange timezone.
Effect on the script
This changes which clock window receives each historical candle in the seasonal aggregation.
When to adjust it
Choose the clock reference that your timing study actually concerns before comparing windows.
Interpretation and limits
Different timezones can produce different buckets and tendencies. A historical time tendency is not a scheduled entry instruction.
Original input tooltip
Timezone used to assign each bar to its clock window. 'exchange' uses the symbol's native exchange timezone.
Minimum Samples / Window
- Input type
int- Source default
10- Available options
Not specified in source- Minimum
3- Maximum
500- Step
Not specified in source
What it controls
A window needs at least this many historical observations before it is scored. Below this it reads 'Building (n)'. Higher values demand more history but produce more reliable edges.
Effect on the script
This sets the sample-count requirement used by the documented scoring or tier gate.
When to adjust it
Set the minimum observation requirement before interpreting the associated score or analytical tier.
Interpretation and limits
Meeting a sample threshold does not establish statistical significance, an enduring edge or future reliability.
Original input tooltip
A window needs at least this many historical observations before it is scored. Below this it reads 'Building (n)'. Higher values demand more history but produce more reliable edges.
Prime Edge Threshold
- Input type
int- Source default
60- Available options
Not specified in source- Minimum
30- Maximum
95- Step
Not specified in source
What it controls
Time Edge score at or above this marks the active window as a Prime window (strong historical directional edge).
Effect on the script
This changes the boundary for the named score classification or qualification gate.
When to adjust it
Specify how strict that classification should be before reviewing the resulting states and samples.
Interpretation and limits
Changing a threshold changes what qualifies. It does not improve the underlying market conditions or establish a success probability.
Original input tooltip
Time Edge score at or above this marks the active window as a Prime window (strong historical directional edge).
Dead-Zone Threshold
- Input type
int- Source default
25- Available options
Not specified in source- Minimum
5- Maximum
60- Step
Not specified in source
What it controls
Time Edge score at or below this marks the active window as a Low-Edge window. If set at or above the Prime threshold, it is capped one point below Prime to keep the states mutually exclusive.
Effect on the script
This changes the boundary for the named score classification or qualification gate.
When to adjust it
Specify how strict that classification should be before reviewing the resulting states and samples.
Interpretation and limits
Changing a threshold changes what qualifies. It does not improve the underlying market conditions or establish a success probability.
Original input tooltip
Time Edge score at or below this marks the active window as a Low-Edge window. If set at or above the Prime threshold, it is capped one point below Prime to keep the states mutually exclusive.
Window Mark Threshold
- Input type
int- Source default
25- Available options
Not specified in source- Minimum
10- Maximum
90- Step
Not specified in source
What it controls
On-chart badges mark the symbol's strongest long and short windows once their Time Edge reaches this floor. Lower = more badges on the chart.
Effect on the script
This changes the boundary for the named score classification or qualification gate.
When to adjust it
Specify how strict that classification should be before reviewing the resulting states and samples.
Interpretation and limits
Changing a threshold changes what qualifies. It does not improve the underlying market conditions or establish a success probability.
Original input tooltip
On-chart badges mark the symbol's strongest long and short windows once their Time Edge reaches this floor. Lower = more badges on the chart.
🖥️ Decision Panel
4 inputsShow Panel
- Input type
bool- Source default
true- Available options
Not specified in source- Minimum
Not specified in source- Maximum
Not specified in source- Step
Not specified in source
What it controls
Toggles show panel for the current workflow.
Effect on the script
This controls the visibility, placement, extent or retained history of the documented visual element. It is part of the chart presentation layer.
When to adjust it
Change it when the active reference is hard to inspect or when historical annotations compete with current price action.
Interpretation and limits
Reducing visible history or hiding an element does not improve the underlying observations. A visual projection is not a price forecast.
Panel Location
- Input type
string- Source default
"Top Right"- Available options
["Top Right", "Middle Right", "Bottom Right", "Top Left", "Middle Left", "Bottom Left", "Bottom Center", "Top Center"]- Minimum
Not specified in source- Maximum
Not specified in source- Step
Not specified in source
What it controls
Sets panel location within the 🖥️ Decision Panel controls.
Effect on the script
This changes presentation and legibility of the relevant chart element, rather than the underlying analytical model.
When to adjust it
Change it when the chart background, screen size or other overlays make the current presentation difficult to read.
Interpretation and limits
A visual preference does not strengthen the measured setup or alter its uncertainty.
Panel Theme
- Input type
string- Source default
"Dark"- Available options
["Dark", "Light"]- Minimum
Not specified in source- Maximum
Not specified in source- Step
Not specified in source
What it controls
Sets panel theme within the 🖥️ Decision Panel controls.
Effect on the script
This changes presentation and legibility of the relevant chart element, rather than the underlying analytical model.
When to adjust it
Change it when the chart background, screen size or other overlays make the current presentation difficult to read.
Interpretation and limits
A visual preference does not strengthen the measured setup or alter its uncertainty.
Panel Font Size
- Input type
string- Source default
"Normal"- Available options
["Tiny", "Small", "Normal", "Large"]- Minimum
Not specified in source- Maximum
Not specified in source- Step
Not specified in source
What it controls
Sets panel font size within the 🖥️ Decision Panel controls.
Effect on the script
This changes presentation and legibility of the relevant chart element, rather than the underlying analytical model.
When to adjust it
Change it when the chart background, screen size or other overlays make the current presentation difficult to read.
Interpretation and limits
A visual preference does not strengthen the measured setup or alter its uncertainty.
🗓️ Seasonal Heatmap
5 inputsShow Heatmap Clock
- Input type
bool- Source default
true- Available options
Not specified in source- Minimum
Not specified in source- Maximum
Not specified in source- Step
Not specified in source
What it controls
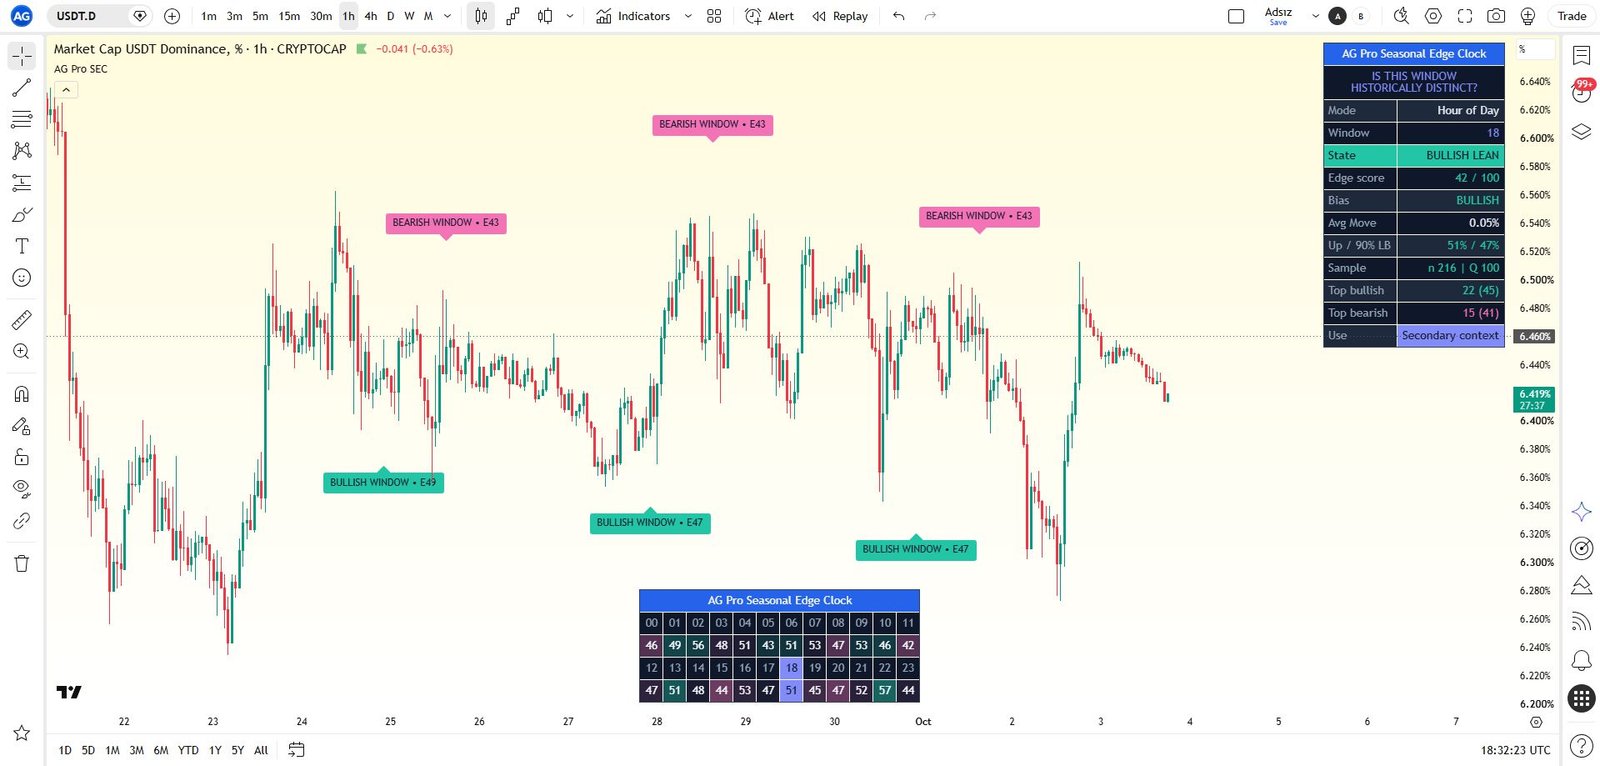
The signature strip that colours every clock window by its historical bias and edge strength, with the active window highlighted.
Effect on the script
This controls the visibility, placement, extent or retained history of the documented visual element. It is part of the chart presentation layer.
When to adjust it
Change it when the active reference is hard to inspect or when historical annotations compete with current price action.
Interpretation and limits
Reducing visible history or hiding an element does not improve the underlying observations. A visual projection is not a price forecast.
Original input tooltip
The signature strip that colours every clock window by its historical bias and edge strength, with the active window highlighted.
Heatmap Location
- Input type
string- Source default
"Bottom Center"- Available options
["Bottom Center", "Top Center", "Bottom Right", "Bottom Left", "Top Right", "Top Left"]- Minimum
Not specified in source- Maximum
Not specified in source- Step
Not specified in source
What it controls
Sets heatmap location within the 🗓️ Seasonal Heatmap controls.
Effect on the script
This supplies the documented value to the associated analytical component.
When to adjust it
Change it when intentionally defining a different analytical assumption, keeping the other settings stable for comparison.
Interpretation and limits
A different configuration changes the model being reviewed; it does not promise a better trading outcome.
Heatmap Font Size
- Input type
string- Source default
"Normal"- Available options
["Tiny", "Small", "Normal"]- Minimum
Not specified in source- Maximum
Not specified in source- Step
Not specified in source
What it controls
Sets heatmap font size within the 🗓️ Seasonal Heatmap controls.
Effect on the script
This changes presentation and legibility of the relevant chart element, rather than the underlying analytical model.
When to adjust it
Change it when the chart background, screen size or other overlays make the current presentation difficult to read.
Interpretation and limits
A visual preference does not strengthen the measured setup or alter its uncertainty.
Clock Layout
- Input type
string- Source default
"Compact"- Available options
["Compact", "Single Strip"]- Minimum
Not specified in source- Maximum
Not specified in source- Step
Not specified in source
What it controls
Compact retains all 24 hours in two 12-column bands. Single Strip restores the original one-row clock; it needs more chart width.
Effect on the script
This supplies the documented value to the associated analytical component.
When to adjust it
Change it when intentionally defining a different analytical assumption, keeping the other settings stable for comparison.
Interpretation and limits
A different configuration changes the model being reviewed; it does not promise a better trading outcome.
Original input tooltip
Compact retains all 24 hours in two 12-column bands. Single Strip restores the original one-row clock; it needs more chart width.
Heatmap Cell Value
- Input type
string- Source default
"Up %"- Available options
["Up %", "Avg Move", "Edge"]- Minimum
Not specified in source- Maximum
Not specified in source- Step
Not specified in source
What it controls
Which statistic each heatmap cell prints. Colour always reflects bias and edge strength.
Effect on the script
This supplies the documented value to the associated analytical component.
When to adjust it
Change it when intentionally defining a different analytical assumption, keeping the other settings stable for comparison.
Interpretation and limits
A different configuration changes the model being reviewed; it does not promise a better trading outcome.
Original input tooltip
Which statistic each heatmap cell prints. Colour always reflects bias and edge strength.
🎯 On-Chart Markers
8 inputsTint Edge Windows
- Input type
bool- Source default
false- Available options
Not specified in source- Minimum
Not specified in source- Maximum
Not specified in source- Step
Not specified in source
What it controls
Optionally shades the background while the symbol's strongest long or short window is active. Disabled by default for a cleaner publication view.
Effect on the script
This changes the observation window or sensitivity of the named calculation feeding the workflow.
When to adjust it
Match the calculation horizon to the analytical question and keep it recorded when comparing results.
Interpretation and limits
Changing the window changes the historical context and can alter warm-up, states and observations. It does not validate a future edge.
Original input tooltip
Optionally shades the background while the symbol's strongest long or short window is active. Disabled by default for a cleaner publication view.
Edge Window Labels
- Input type
bool- Source default
true- Available options
Not specified in source- Minimum
Not specified in source- Maximum
Not specified in source- Step
Not specified in source
What it controls
Places a compact badge when price enters the strongest bullish or bearish window, offset clear of the candles. Badges report direction and the historical Time Edge score.
Effect on the script
This controls the visibility, placement, extent or retained history of the documented visual element. It is part of the chart presentation layer.
When to adjust it
Change it when the active reference is hard to inspect or when historical annotations compete with current price action.
Interpretation and limits
Reducing visible history or hiding an element does not improve the underlying observations. A visual projection is not a price forecast.
Original input tooltip
Places a compact badge when price enters the strongest bullish or bearish window, offset clear of the candles. Badges report direction and the historical Time Edge score.
Label Size
- Input type
string- Source default
"Normal"- Available options
["Tiny", "Small", "Normal", "Large"]- Minimum
Not specified in source- Maximum
Not specified in source- Step
Not specified in source
What it controls
Sets label size within the 🎯 On-Chart Markers controls.
Effect on the script
This controls the visibility, placement, extent or retained history of the documented visual element. It is part of the chart presentation layer.
When to adjust it
Change it when the active reference is hard to inspect or when historical annotations compete with current price action.
Interpretation and limits
Reducing visible history or hiding an element does not improve the underlying observations. A visual projection is not a price forecast.
Min Bars Between Labels
- Input type
int- Source default
52- Available options
Not specified in source- Minimum
0- Maximum
300- Step
Not specified in source
What it controls
Minimum bar spacing between same-side badges. Higher = fewer, sparser, premium badges; lower = denser.
Effect on the script
This controls the visibility, placement, extent or retained history of the documented visual element. It is part of the chart presentation layer.
When to adjust it
Change it when the active reference is hard to inspect or when historical annotations compete with current price action.
Interpretation and limits
Reducing visible history or hiding an element does not improve the underlying observations. A visual projection is not a price forecast.
Original input tooltip
Minimum bar spacing between same-side badges. Higher = fewer, sparser, premium badges; lower = denser.
Cross-Side Label Gap
- Input type
int- Source default
8- Available options
Not specified in source- Minimum
0- Maximum
100- Step
Not specified in source
What it controls
Minimum bars between bullish and bearish badges. Prevents adjacent opposite-side windows from producing overlapping labels.
Effect on the script
This controls the visibility, placement, extent or retained history of the documented visual element. It is part of the chart presentation layer.
When to adjust it
Change it when the active reference is hard to inspect or when historical annotations compete with current price action.
Interpretation and limits
Reducing visible history or hiding an element does not improve the underlying observations. A visual projection is not a price forecast.
Original input tooltip
Minimum bars between bullish and bearish badges. Prevents adjacent opposite-side windows from producing overlapping labels.
Max Visible Labels
- Input type
int- Source default
6- Available options
Not specified in source- Minimum
4- Maximum
20- Step
Not specified in source
What it controls
Maximum recent seasonal-window badges retained on the chart. Older badges are removed first.
Effect on the script
This controls the visibility, placement, extent or retained history of the documented visual element. It is part of the chart presentation layer.
When to adjust it
Change it when the active reference is hard to inspect or when historical annotations compete with current price action.
Interpretation and limits
Reducing visible history or hiding an element does not improve the underlying observations. A visual projection is not a price forecast.
Original input tooltip
Maximum recent seasonal-window badges retained on the chart. Older badges are removed first.
Label Offset ATR
- Input type
float- Source default
0.6- Available options
Not specified in source- Minimum
0.25- Maximum
4.0- Step
0.05
What it controls
ATR-based vertical distance that keeps seasonal-window badges clear of candle bodies and wicks.
Effect on the script
This controls the visibility, placement, extent or retained history of the documented visual element. It is part of the chart presentation layer.
When to adjust it
Change it when the active reference is hard to inspect or when historical annotations compete with current price action.
Interpretation and limits
Reducing visible history or hiding an element does not improve the underlying observations. A visual projection is not a price forecast.
Original input tooltip
ATR-based vertical distance that keeps seasonal-window badges clear of candle bodies and wicks.
ATR Length (label offset)
- Input type
int- Source default
14- Available options
Not specified in source- Minimum
1- Maximum
100- Step
Not specified in source
What it controls
Sets atr length (label offset) within the 🎯 On-Chart Markers controls.
Effect on the script
This controls the visibility, placement, extent or retained history of the documented visual element. It is part of the chart presentation layer.
When to adjust it
Change it when the active reference is hard to inspect or when historical annotations compete with current price action.
Interpretation and limits
Reducing visible history or hiding an element does not improve the underlying observations. A visual projection is not a price forecast.
Keep the settings in context
Change one analytical assumption at a time and compare the same instrument, timeframe and history. A chart reference, score, observation rate or input default does not establish a trade fill, a forward probability or a guaranteed outcome.
Return to the product overview · View this script on TradingView