Use your browser’s Find (Ctrl+F / ⌘F) to locate a setting. Open its row for the full explanation and limits. Source-check time is a verification timestamp, not a script publication date.
Core Structure Engine
5 inputsStructure Pivot Depth
- Input type
int- Source default
9- Available options
Not specified in source- Minimum
2- Maximum
50- Step
Not specified in source
What it controls
Controls how many bars are required on each side of a confirmed swing point. Higher values create fewer but more meaningful structure legs.
Effect on the script
This changes the swing or structural reference used by the documented detection or risk-reference calculation.
When to adjust it
Match the swing scale to the structure you intend to inspect, then review the resulting anchors and confirmation timing.
Interpretation and limits
Confirmed pivots require subsequent bars. Different settings create different structure and can change later events and observations.
Original input tooltip
Controls how many bars are required on each side of a confirmed swing point. Higher values create fewer but more meaningful structure legs.
Use Wicks For Swings
- Input type
bool- Source default
true- Available options
Not specified in source- Minimum
Not specified in source- Maximum
Not specified in source- Step
Not specified in source
What it controls
When enabled, swing highs and lows use candle wicks. When disabled, candle bodies are used for a cleaner close-based structure map.
Effect on the script
This changes the swing or structural reference used by the documented detection or risk-reference calculation.
When to adjust it
Match the swing scale to the structure you intend to inspect, then review the resulting anchors and confirmation timing.
Interpretation and limits
Confirmed pivots require subsequent bars. Different settings create different structure and can change later events and observations.
Original input tooltip
When enabled, swing highs and lows use candle wicks. When disabled, candle bodies are used for a cleaner close-based structure map.
Minimum Swing Deviation %
- Input type
float- Source default
0.35- Available options
Not specified in source- Minimum
0.0- Maximum
Not specified in source- Step
0.05
What it controls
Ignores very small alternating pivots when the price distance from the previous swing is below this percentage.
Effect on the script
This changes the swing or structural reference used by the documented detection or risk-reference calculation.
When to adjust it
Match the swing scale to the structure you intend to inspect, then review the resulting anchors and confirmation timing.
Interpretation and limits
Confirmed pivots require subsequent bars. Different settings create different structure and can change later events and observations.
Original input tooltip
Ignores very small alternating pivots when the price distance from the previous swing is below this percentage.
Minimum Leg Size ATR
- Input type
float- Source default
1.25- Available options
Not specified in source- Minimum
0.2- Maximum
Not specified in source- Step
0.05
What it controls
A confirmed fib leg must be at least this many ATRs wide to receive a strong structure score.
Effect on the script
This changes the documented volatility, risk-distance or location reference used by the analytical workflow.
When to adjust it
Set the relevant risk or distance assumption as part of a coherent plan, then inspect the resulting geometry.
Interpretation and limits
A chart reference is not an account-risk limit, a live stop or a guarantee of execution. Gaps and changing volatility can exceed the reference.
Original input tooltip
A confirmed fib leg must be at least this many ATRs wide to receive a strong structure score.
Stable Live Display
- Input type
bool- Source default
true- Available options
Not specified in source- Minimum
Not specified in source- Maximum
Not specified in source- Step
Not specified in source
What it controls
ON displays the last completed-candle decision during a live bar. OFF previews the current price context. Structure and lifecycle events always commit only on completed candles. Confirmed pivots become known after the selected pivot depth; labels mark their original location.
Effect on the script
This controls whether developing-bar analytics preview live or retain the last completed-candle presentation. The event and observation engine still commits on completed candles.
When to adjust it
Change it when you deliberately want to compare a developing-bar preview with a stable completed-candle display.
Interpretation and limits
A preview is provisional. Turning the preview off does not freeze explicitly live price-distance readouts.
Original input tooltip
ON displays the last completed-candle decision during a live bar. OFF previews the current price context. Structure and lifecycle events always commit only on completed candles. Confirmed pivots become known after the selected pivot depth; labels mark their original location.
Fib Plan Engine
8 inputsShow Fib Framework
- Input type
bool- Source default
true- Available options
Not specified in source- Minimum
Not specified in source- Maximum
Not specified in source- Step
Not specified in source
What it controls
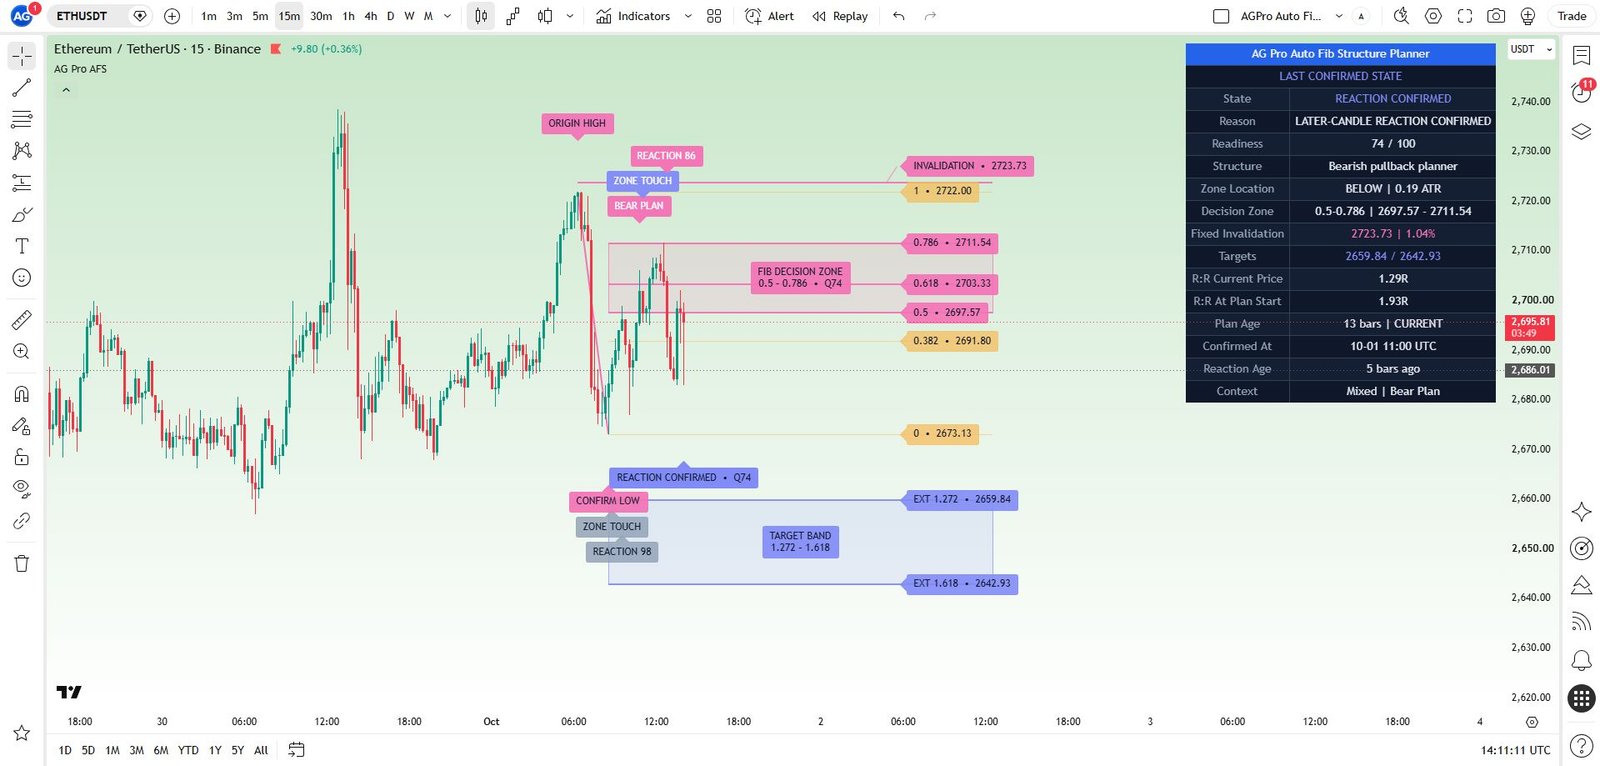
Draws the active confirmed structure leg with key retracement and extension references.
Effect on the script
This controls the visibility, placement, extent or retained history of the documented visual element. It is part of the chart presentation layer.
When to adjust it
Change it when the active reference is hard to inspect or when historical annotations compete with current price action.
Interpretation and limits
Reducing visible history or hiding an element does not improve the underlying observations. A visual projection is not a price forecast.
Original input tooltip
Draws the active confirmed structure leg with key retracement and extension references.
Show Minor Fib Levels
- Input type
bool- Source default
false- Available options
Not specified in source- Minimum
Not specified in source- Maximum
Not specified in source- Step
Not specified in source
What it controls
Adds 0.236 and 0.886 levels. Keep disabled for the cleanest premium default view.
Effect on the script
This controls the visibility, placement, extent or retained history of the documented visual element. It is part of the chart presentation layer.
When to adjust it
Change it when the active reference is hard to inspect or when historical annotations compete with current price action.
Interpretation and limits
Reducing visible history or hiding an element does not improve the underlying observations. A visual projection is not a price forecast.
Original input tooltip
Adds 0.236 and 0.886 levels. Keep disabled for the cleanest premium default view.
Decision Zone Lower Ratio
- Input type
float- Source default
0.5- Available options
Not specified in source- Minimum
0.0- Maximum
1.0- Step
0.001
What it controls
Lower boundary of the fib decision zone measured from the last confirmed swing extreme.
Effect on the script
This changes the swing or structural reference used by the documented detection or risk-reference calculation.
When to adjust it
Match the swing scale to the structure you intend to inspect, then review the resulting anchors and confirmation timing.
Interpretation and limits
Confirmed pivots require subsequent bars. Different settings create different structure and can change later events and observations.
Original input tooltip
Lower boundary of the fib decision zone measured from the last confirmed swing extreme.
Decision Zone Upper Ratio
- Input type
float- Source default
0.786- Available options
Not specified in source- Minimum
0.0- Maximum
1.0- Step
0.001
What it controls
Upper boundary of the fib decision zone. The default maps the 0.500 to 0.786 pullback area.
Effect on the script
This supplies the documented value to the associated analytical component.
When to adjust it
Change it when intentionally defining a different analytical assumption, keeping the other settings stable for comparison.
Interpretation and limits
A different configuration changes the model being reviewed; it does not promise a better trading outcome.
Original input tooltip
Upper boundary of the fib decision zone. The default maps the 0.500 to 0.786 pullback area.
Target Band Start Extension
- Input type
float- Source default
1.272- Available options
Not specified in source- Minimum
1.001- Maximum
4.0- Step
0.001
What it controls
One of the two continuation extension inputs. The smaller configured value becomes the near target automatically.
Effect on the script
This supplies the documented value to the associated analytical component.
When to adjust it
Change it when intentionally defining a different analytical assumption, keeping the other settings stable for comparison.
Interpretation and limits
A different configuration changes the model being reviewed; it does not promise a better trading outcome.
Original input tooltip
One of the two continuation extension inputs. The smaller configured value becomes the near target automatically.
Target Band End Extension
- Input type
float- Source default
1.618- Available options
Not specified in source- Minimum
1.001- Maximum
5.0- Step
0.001
What it controls
One of the two continuation extension inputs. The larger configured value becomes the far target; equal values create one target reference.
Effect on the script
This supplies the documented value to the associated analytical component.
When to adjust it
Change it when intentionally defining a different analytical assumption, keeping the other settings stable for comparison.
Interpretation and limits
A different configuration changes the model being reviewed; it does not promise a better trading outcome.
Original input tooltip
One of the two continuation extension inputs. The larger configured value becomes the far target; equal values create one target reference.
Plan Zone Extension Bars
- Input type
int- Source default
90- Available options
Not specified in source- Minimum
10- Maximum
500- Step
Not specified in source
What it controls
Controls how far the fib decision zone and target band extend to the right. Monthly and weekly charts use an automatic visual cap so projections do not dominate the chart.
Effect on the script
This supplies the documented value to the associated analytical component.
When to adjust it
Change it when intentionally defining a different analytical assumption, keeping the other settings stable for comparison.
Interpretation and limits
A different configuration changes the model being reviewed; it does not promise a better trading outcome.
Original input tooltip
Controls how far the fib decision zone and target band extend to the right. Monthly and weekly charts use an automatic visual cap so projections do not dominate the chart.
Invalidation Buffer ATR
- Input type
float- Source default
0.2- Available options
Not specified in source- Minimum
0.0- Maximum
5.0- Step
0.05
What it controls
Freezes this ATR buffer at plan confirmation beyond the origin swing. A later completed close beyond this fixed rail invalidates the plan.
Effect on the script
This changes the swing or structural reference used by the documented detection or risk-reference calculation.
When to adjust it
Match the swing scale to the structure you intend to inspect, then review the resulting anchors and confirmation timing.
Interpretation and limits
Confirmed pivots require subsequent bars. Different settings create different structure and can change later events and observations.
Original input tooltip
Freezes this ATR buffer at plan confirmation beyond the origin swing. A later completed close beyond this fixed rail invalidates the plan.
Readiness Decision Engine
7 inputsFast Context EMA
- Input type
int- Source default
21- Available options
Not specified in source- Minimum
2- Maximum
200- Step
Not specified in source
What it controls
Fast trend context used in the readiness model and reaction confirmation.
Effect on the script
This supplies the documented value to the associated analytical component.
When to adjust it
Change it when intentionally defining a different analytical assumption, keeping the other settings stable for comparison.
Interpretation and limits
A different configuration changes the model being reviewed; it does not promise a better trading outcome.
Original input tooltip
Fast trend context used in the readiness model and reaction confirmation.
Slow Context EMA
- Input type
int- Source default
55- Available options
Not specified in source- Minimum
3- Maximum
400- Step
Not specified in source
What it controls
Slow trend context used to grade whether the fib plan is aligned with broader structure.
Effect on the script
This supplies the documented value to the associated analytical component.
When to adjust it
Change it when intentionally defining a different analytical assumption, keeping the other settings stable for comparison.
Interpretation and limits
A different configuration changes the model being reviewed; it does not promise a better trading outcome.
Original input tooltip
Slow trend context used to grade whether the fib plan is aligned with broader structure.
Plan Ready Threshold
- Input type
int- Source default
68- Available options
Not specified in source- Minimum
1- Maximum
100- Step
Not specified in source
What it controls
Minimum composite score for Zone Ready. Readiness is a context score, not a success probability; confirmed reaction is a separate later-candle event.
Effect on the script
This changes the boundary for the named score classification or qualification gate.
When to adjust it
Specify how strict that classification should be before reviewing the resulting states and samples.
Interpretation and limits
Changing a threshold changes what qualifies. It does not improve the underlying market conditions or establish a success probability.
Original input tooltip
Minimum composite score for Zone Ready. Readiness is a context score, not a success probability; confirmed reaction is a separate later-candle event.
Deep Pullback Warning Ratio
- Input type
float- Source default
0.886- Available options
Not specified in source- Minimum
0.5- Maximum
1.2- Step
0.001
What it controls
When the active retracement moves beyond this ratio, the panel shifts toward invalidation-watch behavior.
Effect on the script
This supplies the documented value to the associated analytical component.
When to adjust it
Change it when intentionally defining a different analytical assumption, keeping the other settings stable for comparison.
Interpretation and limits
A different configuration changes the model being reviewed; it does not promise a better trading outcome.
Original input tooltip
When the active retracement moves beyond this ratio, the panel shifts toward invalidation-watch behavior.
Reaction Body ATR Filter
- Input type
float- Source default
0.16- Available options
Not specified in source- Minimum
0.0- Maximum
3.0- Step
0.01
What it controls
Minimum candle body, expressed in ATR, used to confirm a meaningful reaction away from the decision zone.
Effect on the script
This changes the documented volatility, risk-distance or location reference used by the analytical workflow.
When to adjust it
Set the relevant risk or distance assumption as part of a coherent plan, then inspect the resulting geometry.
Interpretation and limits
A chart reference is not an account-risk limit, a live stop or a guarantee of execution. Gaps and changing volatility can exceed the reference.
Original input tooltip
Minimum candle body, expressed in ATR, used to confirm a meaningful reaction away from the decision zone.
Good Reward/Risk Level
- Input type
float- Source default
1.35- Available options
Not specified in source- Minimum
0.1- Maximum
10.0- Step
0.05
What it controls
Reward/risk level used inside the 0-100 readiness score. The script does not place trades; it evaluates plan geometry.
Effect on the script
This changes the documented volatility, risk-distance or location reference used by the analytical workflow.
When to adjust it
Set the relevant risk or distance assumption as part of a coherent plan, then inspect the resulting geometry.
Interpretation and limits
A chart reference is not an account-risk limit, a live stop or a guarantee of execution. Gaps and changing volatility can exceed the reference.
Original input tooltip
Reward/risk level used inside the 0-100 readiness score. The script does not place trades; it evaluates plan geometry.
Plan Freshness Limit (Bars)
- Input type
int- Source default
120- Available options
Not specified in source- Minimum
10- Maximum
2000- Step
Not specified in source
What it controls
Bars since the plan actually became available. Older unfinished plans remain visible but are flagged stale and cannot upgrade to Zone Ready or emit a new reaction-confirmation event.
Effect on the script
This sets the documented age, waiting period or forward observation deadline used by the event lifecycle.
When to adjust it
Match the review horizon to the question being studied and keep the deadline explicit in historical comparisons.
Interpretation and limits
Changing a deadline changes which observations resolve, expire or remain eligible. A timed model observation is not a broker trade.
Original input tooltip
Bars since the plan actually became available. Older unfinished plans remain visible but are flagged stale and cannot upgrade to Zone Ready or emit a new reaction-confirmation event.
Visual Design
12 inputsVisual Mode
- Input type
string- Source default
"Premium"- Available options
["Premium", "Institutional", "Showcase"]- Minimum
Not specified in source- Maximum
Not specified in source- Step
Not specified in source
What it controls
Premium is the balanced default. Institutional reduces saturation. Showcase makes key zones more visible for screenshots.
Effect on the script
This selects which documented analytical mode, source or directional context the workflow evaluates.
When to adjust it
Choose the mode that corresponds to your actual analysis before inspecting historical examples.
Interpretation and limits
A selected direction or model is a configuration choice, not evidence that price must follow it.
Original input tooltip
Premium is the balanced default. Institutional reduces saturation. Showcase makes key zones more visible for screenshots.
Show Decision Zone
- Input type
bool- Source default
true- Available options
Not specified in source- Minimum
Not specified in source- Maximum
Not specified in source- Step
Not specified in source
What it controls
Draws the active fib planning zone with centered text inside the rectangle.
Effect on the script
This controls the visibility, placement, extent or retained history of the documented visual element. It is part of the chart presentation layer.
When to adjust it
Change it when the active reference is hard to inspect or when historical annotations compete with current price action.
Interpretation and limits
Reducing visible history or hiding an element does not improve the underlying observations. A visual projection is not a price forecast.
Original input tooltip
Draws the active fib planning zone with centered text inside the rectangle.
Show Target Band
- Input type
bool- Source default
true- Available options
Not specified in source- Minimum
Not specified in source- Maximum
Not specified in source- Step
Not specified in source
What it controls
Draws the projected continuation target band with a centered label inside the rectangle.
Effect on the script
This controls the visibility, placement, extent or retained history of the documented visual element. It is part of the chart presentation layer.
When to adjust it
Change it when the active reference is hard to inspect or when historical annotations compete with current price action.
Interpretation and limits
Reducing visible history or hiding an element does not improve the underlying observations. A visual projection is not a price forecast.
Original input tooltip
Draws the projected continuation target band with a centered label inside the rectangle.
Show Invalidation Line
- Input type
bool- Source default
true- Available options
Not specified in source- Minimum
Not specified in source- Maximum
Not specified in source- Step
Not specified in source
What it controls
Draws the structural invalidation line derived from the origin swing and ATR buffer.
Effect on the script
This controls the visibility, placement, extent or retained history of the documented visual element. It is part of the chart presentation layer.
When to adjust it
Change it when the active reference is hard to inspect or when historical annotations compete with current price action.
Interpretation and limits
Reducing visible history or hiding an element does not improve the underlying observations. A visual projection is not a price forecast.
Original input tooltip
Draws the structural invalidation line derived from the origin swing and ATR buffer.
Show Swing Labels
- Input type
bool- Source default
true- Available options
Not specified in source- Minimum
Not specified in source- Maximum
Not specified in source- Step
Not specified in source
What it controls
Marks the active origin and confirmation swing so the fib plan remains readable.
Effect on the script
This controls the visibility, placement, extent or retained history of the documented visual element. It is part of the chart presentation layer.
When to adjust it
Change it when the active reference is hard to inspect or when historical annotations compete with current price action.
Interpretation and limits
Reducing visible history or hiding an element does not improve the underlying observations. A visual projection is not a price forecast.
Original input tooltip
Marks the active origin and confirmation swing so the fib plan remains readable.
Show Next-Action Label
- Input type
bool- Source default
true- Available options
Not specified in source- Minimum
Not specified in source- Maximum
Not specified in source- Step
Not specified in source
What it controls
Places a compact state label above or below the current bar using ATR spacing so it does not get buried inside candles.
Effect on the script
This controls the visibility, placement, extent or retained history of the documented visual element. It is part of the chart presentation layer.
When to adjust it
Change it when the active reference is hard to inspect or when historical annotations compete with current price action.
Interpretation and limits
Reducing visible history or hiding an element does not improve the underlying observations. A visual projection is not a price forecast.
Original input tooltip
Places a compact state label above or below the current bar using ATR spacing so it does not get buried inside candles.
Show Fib Level Labels
- Input type
bool- Source default
true- Available options
Not specified in source- Minimum
Not specified in source- Maximum
Not specified in source- Step
Not specified in source
What it controls
Labels the key active fib levels on the right side of the chart.
Effect on the script
This controls the visibility, placement, extent or retained history of the documented visual element. It is part of the chart presentation layer.
When to adjust it
Change it when the active reference is hard to inspect or when historical annotations compete with current price action.
Interpretation and limits
Reducing visible history or hiding an element does not improve the underlying observations. A visual projection is not a price forecast.
Original input tooltip
Labels the key active fib levels on the right side of the chart.
Show Recent Event Labels
- Input type
bool- Source default
true- Available options
Not specified in source- Minimum
Not specified in source- Maximum
Not specified in source- Step
Not specified in source
What it controls
Keeps a moderate set of recent plan events on the chart without turning the tool into a crowded signal indicator.
Effect on the script
This controls the visibility, placement, extent or retained history of the documented visual element. It is part of the chart presentation layer.
When to adjust it
Change it when the active reference is hard to inspect or when historical annotations compete with current price action.
Interpretation and limits
Reducing visible history or hiding an element does not improve the underlying observations. A visual projection is not a price forecast.
Original input tooltip
Keeps a moderate set of recent plan events on the chart without turning the tool into a crowded signal indicator.
Max Recent Event Labels
- Input type
int- Source default
5- Available options
Not specified in source- Minimum
0- Maximum
30- Step
Not specified in source
What it controls
Caps recent event labels to protect chart readability and object performance.
Effect on the script
This controls the visibility, placement, extent or retained history of the documented visual element. It is part of the chart presentation layer.
When to adjust it
Change it when the active reference is hard to inspect or when historical annotations compete with current price action.
Interpretation and limits
Reducing visible history or hiding an element does not improve the underlying observations. A visual projection is not a price forecast.
Original input tooltip
Caps recent event labels to protect chart readability and object performance.
Duplicate Event Cooldown Bars
- Input type
int- Source default
12- Available options
Not specified in source- Minimum
0- Maximum
100- Step
Not specified in source
What it controls
Prevents the same event label from printing repeatedly too close together while still allowing different event types to appear.
Effect on the script
This controls the documented persistence, spacing or re-arming requirement for an analytical state or event.
When to adjust it
Choose the stability or spacing requirement before assessing repeated events.
Interpretation and limits
Greater persistence or spacing can delay or suppress events. It does not remove uncertainty or make a retained state permanently valid.
Original input tooltip
Prevents the same event label from printing repeatedly too close together while still allowing different event types to appear.
Label Font Size
- Input type
string- Source default
"Normal"- Available options
["Tiny", "Small", "Normal", "Large"]- Minimum
Not specified in source- Maximum
Not specified in source- Step
Not specified in source
What it controls
Controls all chart labels, including zone text, fib tags, swing markers, action labels, and event labels.
Effect on the script
This changes presentation and legibility of the relevant chart element, rather than the underlying analytical model.
When to adjust it
Change it when the chart background, screen size or other overlays make the current presentation difficult to read.
Interpretation and limits
A visual preference does not strengthen the measured setup or alter its uncertainty.
Original input tooltip
Controls all chart labels, including zone text, fib tags, swing markers, action labels, and event labels.
Label Candle Offset ATR
- Input type
float- Source default
1.1- Available options
Not specified in source- Minimum
0.0- Maximum
5.0- Step
0.05
What it controls
Moves action and event labels away from candle bodies using ATR-based spacing.
Effect on the script
This controls the visibility, placement, extent or retained history of the documented visual element. It is part of the chart presentation layer.
When to adjust it
Change it when the active reference is hard to inspect or when historical annotations compete with current price action.
Interpretation and limits
Reducing visible history or hiding an element does not improve the underlying observations. A visual projection is not a price forecast.
Original input tooltip
Moves action and event labels away from candle bodies using ATR-based spacing.
Panel
4 inputsShow Panel
- Input type
bool- Source default
true- Available options
Not specified in source- Minimum
Not specified in source- Maximum
Not specified in source- Step
Not specified in source
What it controls
Shows or hides the AGPro planning panel. It is enabled by default for the premium decision-engine workflow.
Effect on the script
This controls the visibility, placement, extent or retained history of the documented visual element. It is part of the chart presentation layer.
When to adjust it
Change it when the active reference is hard to inspect or when historical annotations compete with current price action.
Interpretation and limits
Reducing visible history or hiding an element does not improve the underlying observations. A visual projection is not a price forecast.
Original input tooltip
Shows or hides the AGPro planning panel. It is enabled by default for the premium decision-engine workflow.
Panel Location
- Input type
string- Source default
"Top Right"- Available options
["Top Right", "Top Left", "Middle Right", "Middle Left", "Bottom Right", "Bottom Left"]- Minimum
Not specified in source- Maximum
Not specified in source- Step
Not specified in source
What it controls
Selects where the planning panel appears on the chart.
Effect on the script
This changes presentation and legibility of the relevant chart element, rather than the underlying analytical model.
When to adjust it
Change it when the chart background, screen size or other overlays make the current presentation difficult to read.
Interpretation and limits
A visual preference does not strengthen the measured setup or alter its uncertainty.
Original input tooltip
Selects where the planning panel appears on the chart.
Panel Theme
- Input type
string- Source default
"Dark"- Available options
["Dark", "Light"]- Minimum
Not specified in source- Maximum
Not specified in source- Step
Not specified in source
What it controls
Dark uses the AGPro deep panel palette. Light switches to a brighter panel style for light chart backgrounds.
Effect on the script
This changes presentation and legibility of the relevant chart element, rather than the underlying analytical model.
When to adjust it
Change it when the chart background, screen size or other overlays make the current presentation difficult to read.
Interpretation and limits
A visual preference does not strengthen the measured setup or alter its uncertainty.
Original input tooltip
Dark uses the AGPro deep panel palette. Light switches to a brighter panel style for light chart backgrounds.
Panel Font Size
- Input type
string- Source default
"Normal"- Available options
["Tiny", "Small", "Normal", "Large"]- Minimum
Not specified in source- Maximum
Not specified in source- Step
Not specified in source
What it controls
Controls every row inside the planning panel.
Effect on the script
This changes presentation and legibility of the relevant chart element, rather than the underlying analytical model.
When to adjust it
Change it when the chart background, screen size or other overlays make the current presentation difficult to read.
Interpretation and limits
A visual preference does not strengthen the measured setup or alter its uncertainty.
Original input tooltip
Controls every row inside the planning panel.
Alerts
2 inputsEnable Alert Conditions
- Input type
bool- Source default
true- Available options
Not specified in source- Minimum
Not specified in source- Maximum
Not specified in source- Step
Not specified in source
What it controls
Enables rule-based alert conditions for plan creation, decision-zone touch, reaction confirmation, target reach, and invalidation.
Effect on the script
This enables or disables the documented factor or qualification requirement in the workflow.
When to adjust it
Choose whether the condition belongs in your defined checklist before evaluating the resulting states.
Interpretation and limits
Disabling a disagreeing factor changes the model rather than resolving the disagreement.
Original input tooltip
Enables rule-based alert conditions for plan creation, decision-zone touch, reaction confirmation, target reach, and invalidation.
Confirmed Alert Safety Lock
- Input type
bool- Source default
true- Available options
Not specified in source- Minimum
Not specified in source- Maximum
Not specified in source- Step
Not specified in source
What it controls
Lifecycle alerts always evaluate on completed candles. This safety status cannot be disabled.
Effect on the script
This is a read-only safety status in Inputs. The published lifecycle alert gate enforces completed-candle evaluation independently; this display cannot disable that behavior.
When to adjust it
This status is disabled for editing. Configure the separate Enable Alert Conditions switch and the desired TradingView alert instead.
Interpretation and limits
Do not interpret the locked status as an editable switch for intrabar lifecycle alerts. Developing price-distance displays remain a separate matter.
Original input tooltip
Lifecycle alerts always evaluate on completed candles. This safety status cannot be disabled.
Keep the settings in context
Change one analytical assumption at a time and compare the same instrument, timeframe and history. A chart reference, score, observation rate or input default does not establish a trade fill, a forward probability or a guaranteed outcome.
Return to the product overview · View this script on TradingView