Use your browser’s Find (Ctrl+F / ⌘F) to locate a setting. Open its row for the full explanation and limits. Source-check time is a verification timestamp, not a script publication date.
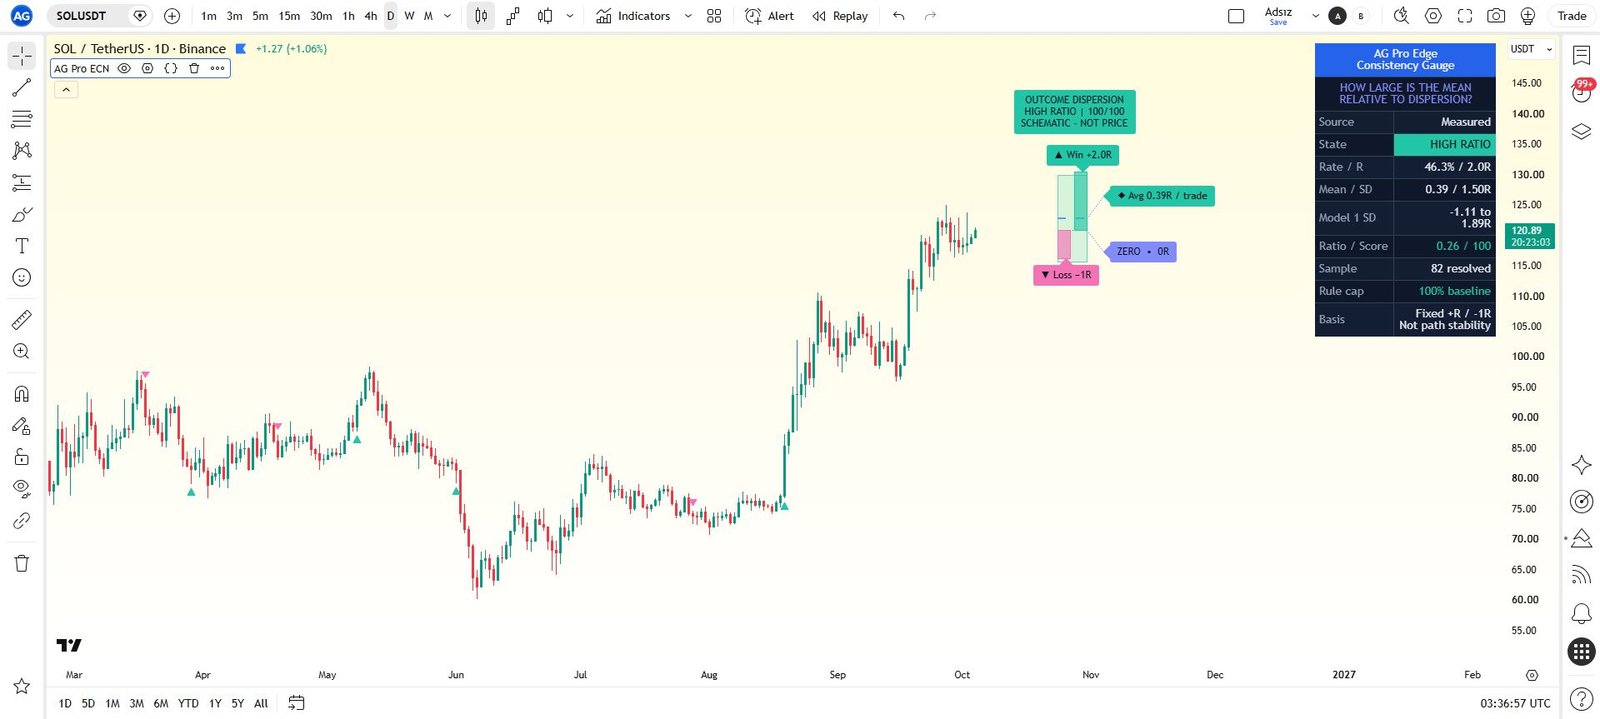
Edge Source
3 inputsWin-rate source
- Input type
string- Source default
"Measured"- Available options
["Measured", "Manual"]- Minimum
Not specified in source- Maximum
Not specified in source- Step
Not specified in source
What it controls
Measured: win rate is read from a built-in trigger + proof engine. Manual: you enter the win rate yourself.
Effect on the script
This chooses measured proxy observations or a manually supplied win-rate assumption as the basis of the outcome model.
When to adjust it
Use the mode corresponding to the evidence you actually have, and keep its assumptions explicit.
Interpretation and limits
A manual assumption is not a measured result, and the built-in proxy is not your personal execution history.
Original input tooltip
Measured: win rate is read from a built-in trigger + proof engine. Manual: you enter the win rate yourself.
Manual win rate (%)
- Input type
float- Source default
45.0- Available options
Not specified in source- Minimum
1- Maximum
99- Step
0.5
What it controls
Defines the win-rate percentage assumption used when the source is Manual.
Effect on the script
This supplies the win-probability assumption to the manual two-outcome model. It is not a measured or forecasted win rate.
When to adjust it
Change it to compare documented assumptions when Manual source is selected.
Interpretation and limits
An optimistic value can make the model appear attractive without supplying any evidence that the assumption is realistic.
Payoff R (reward : risk)
- Input type
float- Source default
2.0- Available options
Not specified in source- Minimum
0.1- Maximum
10- Step
0.1
What it controls
Reward-to-risk of the trade. Wins resolve at +R, losses at -1, which sets the two-outcome distribution this tool measures.
Effect on the script
This changes the documented target or payoff geometry used by the plan, distance comparison or outcome model.
When to adjust it
Set the target assumption before evaluating observations and compare it with the active risk or volatility reference.
Interpretation and limits
A larger projected reward does not establish that the market can deliver it. References are not net returns or actual fills.
Original input tooltip
Reward-to-risk of the trade. Wins resolve at +R, losses at -1, which sets the two-outcome distribution this tool measures.
Measured Engine
8 inputsTrigger EMA length
- Input type
int- Source default
50- Available options
Not specified in source- Minimum
2- Maximum
Not specified in source- Step
Not specified in source
What it controls
A transparent proxy entry: long when price crosses above this EMA, short when it crosses below. A stand-in for your own entry.
Effect on the script
This changes the observation window or sensitivity of the named calculation feeding the workflow.
When to adjust it
Match the calculation horizon to the analytical question and keep it recorded when comparing results.
Interpretation and limits
Changing the window changes the historical context and can alter warm-up, states and observations. It does not validate a future edge.
Original input tooltip
A transparent proxy entry: long when price crosses above this EMA, short when it crosses below. A stand-in for your own entry.
ATR length (risk unit)
- Input type
int- Source default
14- Available options
Not specified in source- Minimum
1- Maximum
Not specified in source- Step
Not specified in source
What it controls
Sets atr length (risk unit) within the Measured Engine controls.
Effect on the script
This changes the documented volatility, risk-distance or location reference used by the analytical workflow.
When to adjust it
Set the relevant risk or distance assumption as part of a coherent plan, then inspect the resulting geometry.
Interpretation and limits
A chart reference is not an account-risk limit, a live stop or a guarantee of execution. Gaps and changing volatility can exceed the reference.
Max bars in trade
- Input type
int- Source default
60- Available options
Not specified in source- Minimum
5- Maximum
Not specified in source- Step
Not specified in source
What it controls
If neither target nor stop is reached within this many bars, the observation expires. Expired observations are excluded from scoring and reported in the panel audit.
Effect on the script
This sets the documented age, waiting period or forward observation deadline used by the event lifecycle.
When to adjust it
Match the review horizon to the question being studied and keep the deadline explicit in historical comparisons.
Interpretation and limits
Changing a deadline changes which observations resolve, expire or remain eligible. A timed model observation is not a broker trade.
Original input tooltip
If neither target nor stop is reached within this many bars, the observation expires. Expired observations are excluded from scoring and reported in the panel audit.
Min samples before scoring
- Input type
int- Source default
10- Available options
Not specified in source- Minimum
2- Maximum
Not specified in source- Step
Not specified in source
What it controls
Sets min samples before scoring within the Measured Engine controls.
Effect on the script
This sets the sample-count requirement used by the documented scoring or tier gate.
When to adjust it
Set the minimum observation requirement before interpreting the associated score or analytical tier.
Interpretation and limits
Meeting a sample threshold does not establish statistical significance, an enduring edge or future reliability.
Proof-engine lookback (bars, 0 = all history)
- Input type
int- Source default
0- Available options
Not specified in source- Minimum
0- Maximum
Not specified in source- Step
Not specified in source
What it controls
On each full script recalculation, limits simulation to the latest N chart bars. 0 uses all loaded history. Counters then accumulate forward until the next recalculation; this is an initialization window, not a continuously rolling sample.
Effect on the script
This limits the simulation initialization window on a full recalculation. Counters subsequently accumulate forward; it is not a continuously rolling sample.
When to adjust it
Choose the historical scope deliberately before comparing model observations across charts or configurations.
Interpretation and limits
A shorter history changes the evidence available to the study. It is not proof of better results or a measured speed improvement.
Original input tooltip
On each full script recalculation, limits simulation to the latest N chart bars. 0 uses all loaded history. Counters then accumulate forward until the next recalculation; this is an initialization window, not a continuously rolling sample.
Same-bar target & stop
- Input type
string- Source default
"Exclude"- Available options
["Exclude", "Stop First", "Target First"]- Minimum
Not specified in source- Maximum
Not specified in source- Step
Not specified in source
What it controls
Historical OHLC bars do not reveal which level was touched first. Exclude removes ambiguous observations; Stop First is conservative; Target First preserves the optimistic assumption.
Effect on the script
This selects the declared treatment of an OHLC candle that reaches both risk and target references without revealing their intrabar order.
When to adjust it
Set the ambiguity assumption before comparing historical observations, and keep it unchanged across comparisons.
Interpretation and limits
Historical OHLC cannot reconstruct the first touch. An optimistic or conservative assumption changes the recorded sample; neither proves a broker fill.
Original input tooltip
Historical OHLC bars do not reveal which level was touched first. Exclude removes ambiguous observations; Stop First is conservative; Target First preserves the optimistic assumption.
Show win / loss markers
- Input type
bool- Source default
true- Available options
Not specified in source- Minimum
Not specified in source- Maximum
Not specified in source- Step
Not specified in source
What it controls
Toggles show win / loss markers for the current workflow.
Effect on the script
This controls the visibility, placement, extent or retained history of the documented visual element. It is part of the chart presentation layer.
When to adjust it
Change it when the active reference is hard to inspect or when historical annotations compete with current price action.
Interpretation and limits
Reducing visible history or hiding an element does not improve the underlying observations. A visual projection is not a price forecast.
Marker history (bars)
- Input type
int- Source default
1200- Available options
Not specified in source- Minimum
100- Maximum
5000- Step
Not specified in source
What it controls
Limits historical win/loss markers to the latest chart bars for a cleaner chart and lower visual load. The measured proof engine remains unchanged.
Effect on the script
This limits the bars over which historical outcome markers are displayed, without changing the measured proof engine.
When to adjust it
Change it when the active reference is hard to inspect or when historical annotations compete with current price action.
Interpretation and limits
Reducing visible history or hiding an element does not improve the underlying observations. A visual projection is not a price forecast.
Original input tooltip
Limits historical win/loss markers to the latest chart bars for a cleaner chart and lower visual load. The measured proof engine remains unchanged.
Consistency
1 inputConsistency ratio scale
- Input type
float- Source default
0.25- Available options
Not specified in source- Minimum
0.05- Maximum
Not specified in source- Step
0.01
What it controls
Mean divided by modeled outcome sigma that maps to a full score. This is a user-scaled diagnostic, not a probability, stability test or confidence measure.
Effect on the script
This changes the diagnostic score scaling or the analytical baseline-cap tier described by this control.
When to adjust it
Specify the diagnostic scale and tier policy before comparing results, and retain the same policy across the study.
Interpretation and limits
A score or tier is not a calibrated probability or personalized position size. Changing its scale does not improve the underlying outcome distribution.
Original input tooltip
Mean divided by modeled outcome sigma that maps to a full score. This is a user-scaled diagnostic, not a probability, stability test or confidence measure.
Position Model (Decision Layer)
5 inputsFull-tier score threshold
- Input type
float- Source default
78- Available options
Not specified in source- Minimum
50- Maximum
100- Step
1
What it controls
Consistency score that opens the 100% baseline model tier. This is an analytical cap, not a position-size instruction.
Effect on the script
This changes the diagnostic score scaling or the analytical baseline-cap tier described by this control.
When to adjust it
Specify the diagnostic scale and tier policy before comparing results, and retain the same policy across the study.
Interpretation and limits
A score or tier is not a calibrated probability or personalized position size. Changing its scale does not improve the underlying outcome distribution.
Original input tooltip
Consistency score that opens the 100% baseline model tier. This is an analytical cap, not a position-size instruction.
Reduced-tier score threshold
- Input type
float- Source default
60- Available options
Not specified in source- Minimum
30- Maximum
99- Step
1
What it controls
Consistency score that opens the reduced middle model tier. Custom threshold order is normalized automatically.
Effect on the script
This changes the diagnostic score scaling or the analytical baseline-cap tier described by this control.
When to adjust it
Specify the diagnostic scale and tier policy before comparing results, and retain the same policy across the study.
Interpretation and limits
A score or tier is not a calibrated probability or personalized position size. Changing its scale does not improve the underlying outcome distribution.
Original input tooltip
Consistency score that opens the reduced middle model tier. Custom threshold order is normalized automatically.
Full-tier minimum samples
- Input type
int- Source default
30- Available options
Not specified in source- Minimum
10- Maximum
500- Step
Not specified in source
What it controls
Measured mode must reach this many resolved outcomes before the full baseline tier can open. A high consistency score below this threshold remains provisional.
Effect on the script
This sets the sample-count requirement used by the documented scoring or tier gate.
When to adjust it
Set the minimum observation requirement before interpreting the associated score or analytical tier.
Interpretation and limits
Meeting a sample threshold does not establish statistical significance, an enduring edge or future reliability.
Original input tooltip
Measured mode must reach this many resolved outcomes before the full baseline tier can open. A high consistency score below this threshold remains provisional.
Mid-tier cap (%)
- Input type
int- Source default
75- Available options
Not specified in source- Minimum
10- Maximum
100- Step
Not specified in source
What it controls
Analytical cap for the middle tier as a percentage of the user-defined baseline. Custom cap order is normalized automatically.
Effect on the script
This changes the diagnostic score scaling or the analytical baseline-cap tier described by this control.
When to adjust it
Specify the diagnostic scale and tier policy before comparing results, and retain the same policy across the study.
Interpretation and limits
A score or tier is not a calibrated probability or personalized position size. Changing its scale does not improve the underlying outcome distribution.
Original input tooltip
Analytical cap for the middle tier as a percentage of the user-defined baseline. Custom cap order is normalized automatically.
Low-tier cap (%)
- Input type
int- Source default
50- Available options
Not specified in source- Minimum
5- Maximum
100- Step
Not specified in source
What it controls
Analytical cap for the lower tier as a percentage of the user-defined baseline. Custom cap order is normalized automatically.
Effect on the script
This changes the diagnostic score scaling or the analytical baseline-cap tier described by this control.
When to adjust it
Specify the diagnostic scale and tier policy before comparing results, and retain the same policy across the study.
Interpretation and limits
A score or tier is not a calibrated probability or personalized position size. Changing its scale does not improve the underlying outcome distribution.
Original input tooltip
Analytical cap for the lower tier as a percentage of the user-defined baseline. Custom cap order is normalized automatically.
Outcome Bars
5 inputsShow outcome bars
- Input type
bool- Source default
true- Available options
Not specified in source- Minimum
Not specified in source- Maximum
Not specified in source- Step
Not specified in source
What it controls
Toggles show outcome bars for the current workflow.
Effect on the script
This controls the visibility, placement, extent or retained history of the documented visual element. It is part of the chart presentation layer.
When to adjust it
Change it when the active reference is hard to inspect or when historical annotations compete with current price action.
Interpretation and limits
Reducing visible history or hiding an element does not improve the underlying observations. A visual projection is not a price forecast.
Bars distance from last bar
- Input type
int- Source default
20- Available options
Not specified in source- Minimum
1- Maximum
40- Step
Not specified in source
What it controls
Sets bars distance from last bar within the Outcome Bars controls.
Effect on the script
This controls the visibility, placement, extent or retained history of the documented visual element. It is part of the chart presentation layer.
When to adjust it
Change it when the active reference is hard to inspect or when historical annotations compete with current price action.
Interpretation and limits
Reducing visible history or hiding an element does not improve the underlying observations. A visual projection is not a price forecast.
Bar width (bars)
- Input type
int- Source default
3- Available options
Not specified in source- Minimum
1- Maximum
10- Step
Not specified in source
What it controls
Sets bar width (bars) within the Outcome Bars controls.
Effect on the script
This supplies the documented value to the associated analytical component.
When to adjust it
Change it when intentionally defining a different analytical assumption, keeping the other settings stable for comparison.
Interpretation and limits
A different configuration changes the model being reviewed; it does not promise a better trading outcome.
Vertical scale (× ATR)
- Input type
float- Source default
1.0- Available options
Not specified in source- Minimum
0.2- Maximum
5.0- Step
0.1
What it controls
Scales how tall the outcome bars render relative to the ATR risk unit. Visual only — does not affect the math.
Effect on the script
This controls the visibility, placement, extent or retained history of the documented visual element. It is part of the chart presentation layer.
When to adjust it
Change it when the active reference is hard to inspect or when historical annotations compete with current price action.
Interpretation and limits
Reducing visible history or hiding an element does not improve the underlying observations. A visual projection is not a price forecast.
Original input tooltip
Scales how tall the outcome bars render relative to the ATR risk unit. Visual only — does not affect the math.
Label font size
- Input type
string- Source default
"Normal"- Available options
["Tiny", "Small", "Normal", "Large"]- Minimum
Not specified in source- Maximum
Not specified in source- Step
Not specified in source
What it controls
Sets label font size within the Outcome Bars controls.
Effect on the script
This changes presentation and legibility of the relevant chart element, rather than the underlying analytical model.
When to adjust it
Change it when the chart background, screen size or other overlays make the current presentation difficult to read.
Interpretation and limits
A visual preference does not strengthen the measured setup or alter its uncertainty.
Decision Panel
5 inputsShow panel
- Input type
bool- Source default
true- Available options
Not specified in source- Minimum
Not specified in source- Maximum
Not specified in source- Step
Not specified in source
What it controls
Toggles show panel for the current workflow.
Effect on the script
This controls the visibility, placement, extent or retained history of the documented visual element. It is part of the chart presentation layer.
When to adjust it
Change it when the active reference is hard to inspect or when historical annotations compete with current price action.
Interpretation and limits
Reducing visible history or hiding an element does not improve the underlying observations. A visual projection is not a price forecast.
Panel position
- Input type
string- Source default
"Top Right"- Available options
["Top Right", "Top Left", "Top Center", "Middle Right", "Middle Left", "Bottom Right", "Bottom Left", "Bottom Center"]- Minimum
Not specified in source- Maximum
Not specified in source- Step
Not specified in source
What it controls
Sets panel position within the Decision Panel controls.
Effect on the script
This changes presentation and legibility of the relevant chart element, rather than the underlying analytical model.
When to adjust it
Change it when the chart background, screen size or other overlays make the current presentation difficult to read.
Interpretation and limits
A visual preference does not strengthen the measured setup or alter its uncertainty.
Theme
- Input type
string- Source default
"Dark"- Available options
["Dark", "Light"]- Minimum
Not specified in source- Maximum
Not specified in source- Step
Not specified in source
What it controls
Sets theme within the Decision Panel controls.
Effect on the script
This changes presentation and legibility of the relevant chart element, rather than the underlying analytical model.
When to adjust it
Change it when the chart background, screen size or other overlays make the current presentation difficult to read.
Interpretation and limits
A visual preference does not strengthen the measured setup or alter its uncertainty.
Panel page
- Input type
string- Source default
"Overview"- Available options
["Overview", "Audit"]- Minimum
Not specified in source- Maximum
Not specified in source- Step
Not specified in source
What it controls
Overview shows the fixed-outcome model. Audit shows resolved, excluded and expired observations plus tier settings.
Effect on the script
This selects which part of the existing analytical readout is visible in the dashboard. It does not create a different event engine.
When to adjust it
Use a compact or overview page for routine reading and the detailed pages when inspecting assumptions, observations or exclusions.
Interpretation and limits
Information hidden by a page choice can still matter. Check the evidence and model assumptions before relying on a headline score.
Original input tooltip
Overview shows the fixed-outcome model. Audit shows resolved, excluded and expired observations plus tier settings.
Panel font size
- Input type
string- Source default
"Normal"- Available options
["Tiny", "Small", "Normal", "Large"]- Minimum
Not specified in source- Maximum
Not specified in source- Step
Not specified in source
What it controls
Sets panel font size within the Decision Panel controls.
Effect on the script
This changes presentation and legibility of the relevant chart element, rather than the underlying analytical model.
When to adjust it
Change it when the chart background, screen size or other overlays make the current presentation difficult to read.
Interpretation and limits
A visual preference does not strengthen the measured setup or alter its uncertainty.
Keep the settings in context
Change one analytical assumption at a time and compare the same instrument, timeframe and history. A chart reference, score, observation rate or input default does not establish a trade fill, a forward probability or a guaranteed outcome.
Return to the product overview · View this script on TradingView