Use your browser’s Find (Ctrl+F / ⌘F) to locate a setting. Open its row for the full explanation and limits. Source-check time is a verification timestamp, not a script publication date.
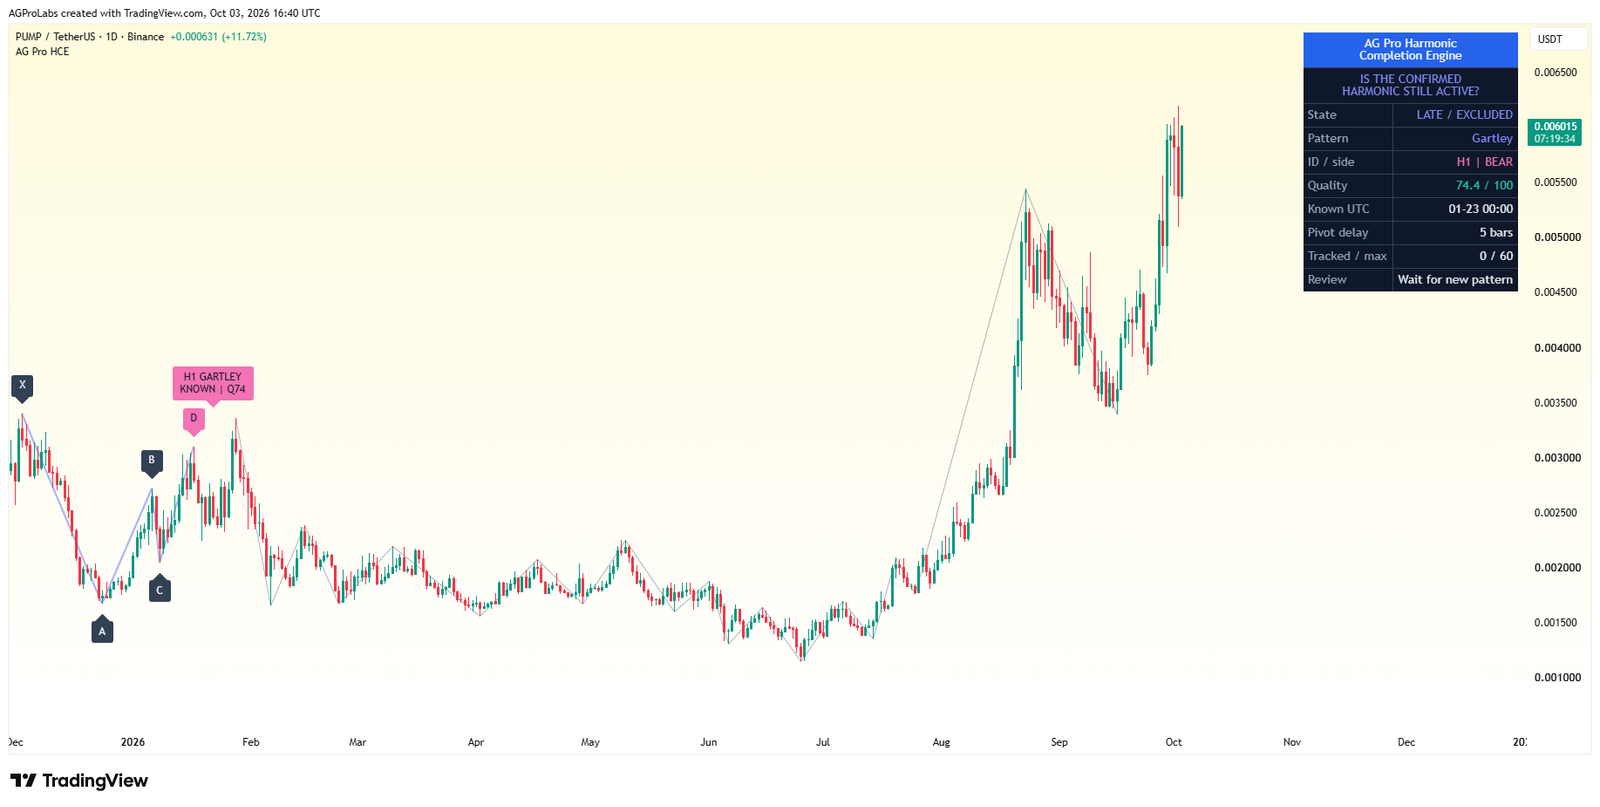
General & Display
11 inputsShow Panel
- Input type
bool- Source default
true- Available options
Not specified in source- Minimum
Not specified in source- Maximum
Not specified in source- Step
Not specified in source
What it controls
Toggle the on-chart decision panel. Enabled by default.
Effect on the script
This controls the visibility, placement, extent or retained history of the documented visual element. It is part of the chart presentation layer.
When to adjust it
Change it when the active reference is hard to inspect or when historical annotations compete with current price action.
Interpretation and limits
Reducing visible history or hiding an element does not improve the underlying observations. A visual projection is not a price forecast.
Original input tooltip
Toggle the on-chart decision panel. Enabled by default.
Panel Theme
- Input type
string- Source default
"Dark"- Available options
["Dark", "Light"]- Minimum
Not specified in source- Maximum
Not specified in source- Step
Not specified in source
What it controls
Choose contrast-safe panel colors independently of the chart background.
Effect on the script
This changes presentation and legibility of the relevant chart element, rather than the underlying analytical model.
When to adjust it
Change it when the chart background, screen size or other overlays make the current presentation difficult to read.
Interpretation and limits
A visual preference does not strengthen the measured setup or alter its uncertainty.
Original input tooltip
Choose contrast-safe panel colors independently of the chart background.
Panel Location
- Input type
string- Source default
"Top Right"- Available options
["Top Right", "Top Left", "Bottom Right", "Bottom Left", "Middle Right"]- Minimum
Not specified in source- Maximum
Not specified in source- Step
Not specified in source
What it controls
Anchor the compact panel without changing analytical calculations.
Effect on the script
This changes presentation and legibility of the relevant chart element, rather than the underlying analytical model.
When to adjust it
Change it when the chart background, screen size or other overlays make the current presentation difficult to read.
Interpretation and limits
A visual preference does not strengthen the measured setup or alter its uncertainty.
Original input tooltip
Anchor the compact panel without changing analytical calculations.
Panel Font Size
- Input type
string- Source default
"Normal"- Available options
["Small", "Normal", "Large"]- Minimum
Not specified in source- Maximum
Not specified in source- Step
Not specified in source
What it controls
Normal is the readable default. Select a page to access additional metrics.
Effect on the script
This changes presentation and legibility of the relevant chart element, rather than the underlying analytical model.
When to adjust it
Change it when the chart background, screen size or other overlays make the current presentation difficult to read.
Interpretation and limits
A visual preference does not strengthen the measured setup or alter its uncertainty.
Original input tooltip
Normal is the readable default. Select a page to access additional metrics.
Label Font Size
- Input type
string- Source default
"Normal"- Available options
["Small", "Normal", "Large"]- Minimum
Not specified in source- Maximum
Not specified in source- Step
Not specified in source
What it controls
Controls filled point, confirmation and zone badges.
Effect on the script
This changes presentation and legibility of the relevant chart element, rather than the underlying analytical model.
When to adjust it
Change it when the chart background, screen size or other overlays make the current presentation difficult to read.
Interpretation and limits
A visual preference does not strengthen the measured setup or alter its uncertainty.
Original input tooltip
Controls filled point, confirmation and zone badges.
Panel Page
- Input type
string- Source default
"Overview"- Available options
["Overview", "Ratios", "References", "Evidence"]- Minimum
Not specified in source- Maximum
Not specified in source- Step
Not specified in source
What it controls
Compact pages separate the latest known pattern, frozen ratios, price references and eligible observation outcomes.
Effect on the script
This selects which part of the existing analytical readout is visible in the dashboard. It does not create a different event engine.
When to adjust it
Use a compact or overview page for routine reading and the detailed pages when inspecting assumptions, observations or exclusions.
Interpretation and limits
Information hidden by a page choice can still matter. Check the evidence and model assumptions before relying on a headline score.
Original input tooltip
Compact pages separate the latest known pattern, frozen ratios, price references and eligible observation outcomes.
Show Pivot Structure
- Input type
bool- Source default
true- Available options
Not specified in source- Minimum
Not specified in source- Maximum
Not specified in source- Step
Not specified in source
What it controls
Draw a light zig-zag through confirmed swing pivots for continuous context.
Effect on the script
This controls the visibility, placement, extent or retained history of the documented visual element. It is part of the chart presentation layer.
When to adjust it
Change it when the active reference is hard to inspect or when historical annotations compete with current price action.
Interpretation and limits
Reducing visible history or hiding an element does not improve the underlying observations. A visual projection is not a price forecast.
Original input tooltip
Draw a light zig-zag through confirmed swing pivots for continuous context.
Show Pattern
- Input type
bool- Source default
true- Available options
Not specified in source- Minimum
Not specified in source- Maximum
Not specified in source- Step
Not specified in source
What it controls
Draw the active XABCD pattern polyline and point labels.
Effect on the script
This controls the visibility, placement, extent or retained history of the documented visual element. It is part of the chart presentation layer.
When to adjust it
Change it when the active reference is hard to inspect or when historical annotations compete with current price action.
Interpretation and limits
Reducing visible history or hiding an element does not improve the underlying observations. A visual projection is not a price forecast.
Original input tooltip
Draw the active XABCD pattern polyline and point labels.
Show PRZ Zone
- Input type
bool- Source default
true- Available options
Not specified in source- Minimum
Not specified in source- Maximum
Not specified in source- Step
Not specified in source
What it controls
Draw the potential reversal zone with a centered pattern label.
Effect on the script
This controls the visibility, placement, extent or retained history of the documented visual element. It is part of the chart presentation layer.
When to adjust it
Change it when the active reference is hard to inspect or when historical annotations compete with current price action.
Interpretation and limits
Reducing visible history or hiding an element does not improve the underlying observations. A visual projection is not a price forecast.
Original input tooltip
Draw the potential reversal zone with a centered pattern label.
Show Reference Levels
- Input type
bool- Source default
true- Available options
Not specified in source- Minimum
Not specified in source- Maximum
Not specified in source- Step
Not specified in source
What it controls
Draw frozen D, failure and target references for the current eligible observation. Touches are OHLC observations, not executed trades.
Effect on the script
This controls the visibility, placement, extent or retained history of the documented visual element. It is part of the chart presentation layer.
When to adjust it
Change it when the active reference is hard to inspect or when historical annotations compete with current price action.
Interpretation and limits
Reducing visible history or hiding an element does not improve the underlying observations. A visual projection is not a price forecast.
Original input tooltip
Draw frozen D, failure and target references for the current eligible observation. Touches are OHLC observations, not executed trades.
Show Completion Markers
- Input type
bool- Source default
true- Available options
Not specified in source- Minimum
Not specified in source- Maximum
Not specified in source- Step
Not specified in source
What it controls
Mark the closed candle where a pattern becomes known, after D pivot confirmation. Geometry point labels refer to earlier pivot bars, not signal times.
Effect on the script
This controls the visibility, placement, extent or retained history of the documented visual element. It is part of the chart presentation layer.
When to adjust it
Change it when the active reference is hard to inspect or when historical annotations compete with current price action.
Interpretation and limits
Reducing visible history or hiding an element does not improve the underlying observations. A visual projection is not a price forecast.
Original input tooltip
Mark the closed candle where a pattern becomes known, after D pivot confirmation. Geometry point labels refer to earlier pivot bars, not signal times.
Detection
6 inputsPivot Length
- Input type
int- Source default
5- Available options
Not specified in source- Minimum
2- Maximum
50- Step
Not specified in source
What it controls
Bars on each side of a swing pivot. Higher = larger, fewer patterns.
Effect on the script
This changes the swing or structural reference used by the documented detection or risk-reference calculation.
When to adjust it
Match the swing scale to the structure you intend to inspect, then review the resulting anchors and confirmation timing.
Interpretation and limits
Confirmed pivots require subsequent bars. Different settings create different structure and can change later events and observations.
Original input tooltip
Bars on each side of a swing pivot. Higher = larger, fewer patterns.
Ratio Tolerance
- Input type
float- Source default
0.12- Available options
Not specified in source- Minimum
0.02- Maximum
0.4- Step
0.01
What it controls
How far the measured Fibonacci ratios may deviate from the ideal before a pattern is rejected.
Effect on the script
This changes how demanding the named qualification, pressure or pattern-fit assessment is.
When to adjust it
Define the selectivity appropriate to the specific structural or flow question before comparing examples.
Interpretation and limits
A more permissive setting can admit marginal context; stricter qualification can delay or exclude events. Neither guarantees better outcomes.
Original input tooltip
How far the measured Fibonacci ratios may deviate from the ideal before a pattern is rejected.
Minimum Ratio Score
- Input type
int- Source default
55- Available options
Not specified in source- Minimum
1- Maximum
100- Step
Not specified in source
What it controls
Lowest ratio-precision score a pattern must reach to be recorded.
Effect on the script
This changes the boundary for the named score classification or qualification gate.
When to adjust it
Specify how strict that classification should be before reviewing the resulting states and samples.
Interpretation and limits
Changing a threshold changes what qualifies. It does not improve the underlying market conditions or establish a success probability.
Original input tooltip
Lowest ratio-precision score a pattern must reach to be recorded.
Ready Quality
- Input type
int- Source default
70- Available options
Not specified in source- Minimum
1- Maximum
100- Step
Not specified in source
What it controls
Composite Quality at or above which a completed pattern is treated as Ready.
Effect on the script
This changes the boundary for the named score classification or qualification gate.
When to adjust it
Specify how strict that classification should be before reviewing the resulting states and samples.
Interpretation and limits
Changing a threshold changes what qualifies. It does not improve the underlying market conditions or establish a success probability.
Original input tooltip
Composite Quality at or above which a completed pattern is treated as Ready.
Location Lookback
- Input type
int- Source default
100- Available options
Not specified in source- Minimum
20- Maximum
500- Step
Not specified in source
What it controls
Bars used to measure where D sits in the recent range (premium vs discount), feeding the Location factor.
Effect on the script
This changes the observation window or sensitivity of the named calculation feeding the workflow.
When to adjust it
Match the calculation horizon to the analytical question and keep it recorded when comparing results.
Interpretation and limits
Changing the window changes the historical context and can alter warm-up, states and observations. It does not validate a future edge.
Original input tooltip
Bars used to measure where D sits in the recent range (premium vs discount), feeding the Location factor.
Calculation Window (Bars)
- Input type
int- Source default
1500- Available options
Not specified in source- Minimum
200- Maximum
20000- Step
Not specified in source
What it controls
How many recent bars the engine processes. Lower = faster draw on long histories.
Effect on the script
This defines the portion of loaded history initialized or processed by the documented historical model.
When to adjust it
Choose the historical scope deliberately before comparing model observations across charts or configurations.
Interpretation and limits
A shorter history changes the evidence available to the study. It is not proof of better results or a measured speed improvement.
Original input tooltip
How many recent bars the engine processes. Lower = faster draw on long histories.
Risk & Targets
6 inputsStop Buffer (ATR)
- Input type
float- Source default
1.5- Available options
Not specified in source- Minimum
0.1- Maximum
5.0- Step
0.1
What it controls
ATR padding beyond the completion point (D) for the stop.
Effect on the script
This changes the documented volatility, risk-distance or location reference used by the analytical workflow.
When to adjust it
Set the relevant risk or distance assumption as part of a coherent plan, then inspect the resulting geometry.
Interpretation and limits
A chart reference is not an account-risk limit, a live stop or a guarantee of execution. Gaps and changing volatility can exceed the reference.
Original input tooltip
ATR padding beyond the completion point (D) for the stop.
PRZ Half-Width (ATR)
- Input type
float- Source default
0.4- Available options
Not specified in source- Minimum
0.1- Maximum
5.0- Step
0.1
What it controls
Half the height of the PRZ zone, in ATR multiples.
Effect on the script
This changes the documented volatility, risk-distance or location reference used by the analytical workflow.
When to adjust it
Set the relevant risk or distance assumption as part of a coherent plan, then inspect the resulting geometry.
Interpretation and limits
A chart reference is not an account-risk limit, a live stop or a guarantee of execution. Gaps and changing volatility can exceed the reference.
Original input tooltip
Half the height of the PRZ zone, in ATR multiples.
Target 1 (AD retrace)
- Input type
float- Source default
0.382- Available options
Not specified in source- Minimum
0.1- Maximum
1.0- Step
0.001
What it controls
Target 1 as a retracement of the A-to-D leg.
Effect on the script
This changes the documented target or payoff geometry used by the plan, distance comparison or outcome model.
When to adjust it
Set the target assumption before evaluating observations and compare it with the active risk or volatility reference.
Interpretation and limits
A larger projected reward does not establish that the market can deliver it. References are not net returns or actual fills.
Original input tooltip
Target 1 as a retracement of the A-to-D leg.
Target 2 (AD retrace)
- Input type
float- Source default
0.618- Available options
Not specified in source- Minimum
0.1- Maximum
1.0- Step
0.001
What it controls
Target 2 as a retracement of the A-to-D leg.
Effect on the script
This changes the documented target or payoff geometry used by the plan, distance comparison or outcome model.
When to adjust it
Set the target assumption before evaluating observations and compare it with the active risk or volatility reference.
Interpretation and limits
A larger projected reward does not establish that the market can deliver it. References are not net returns or actual fills.
Original input tooltip
Target 2 as a retracement of the A-to-D leg.
Setup Expiry (Bars)
- Input type
int- Source default
60- Available options
Not specified in source- Minimum
5- Maximum
500- Step
Not specified in source
What it controls
Hard observation deadline counted from the confirmation close. Stop and target touches on the last allowed bar are processed first; expired observations never reopen.
Effect on the script
This sets the documented age, waiting period or forward observation deadline used by the event lifecycle.
When to adjust it
Match the review horizon to the question being studied and keep the deadline explicit in historical comparisons.
Interpretation and limits
Changing a deadline changes which observations resolve, expire or remain eligible. A timed model observation is not a broker trade.
Original input tooltip
Hard observation deadline counted from the confirmation close. Stop and target touches on the last allowed bar are processed first; expired observations never reopen.
ATR Length
- Input type
int- Source default
14- Available options
Not specified in source- Minimum
1- Maximum
Not specified in source- Step
Not specified in source
What it controls
ATR smoothing used to freeze the PRZ width and failure reference at D.
Effect on the script
This changes the documented volatility, risk-distance or location reference used by the analytical workflow.
When to adjust it
Set the relevant risk or distance assumption as part of a coherent plan, then inspect the resulting geometry.
Interpretation and limits
A chart reference is not an account-risk limit, a live stop or a guarantee of execution. Gaps and changing volatility can exceed the reference.
Original input tooltip
ATR smoothing used to freeze the PRZ width and failure reference at D.
Labels
4 inputsMarker Offset (ATR)
- Input type
float- Source default
0.35- Available options
Not specified in source- Minimum
0.0- Maximum
1.0- Step
0.05
What it controls
Local wick clearance for confirmation badges. Recent visual positions may adjust for neighboring candles; event bars do not move.
Effect on the script
This controls the visibility, placement, extent or retained history of the documented visual element. It is part of the chart presentation layer.
When to adjust it
Change it when the active reference is hard to inspect or when historical annotations compete with current price action.
Interpretation and limits
Reducing visible history or hiding an element does not improve the underlying observations. A visual projection is not a price forecast.
Original input tooltip
Local wick clearance for confirmation badges. Recent visual positions may adjust for neighboring candles; event bars do not move.
Level Forward Bars
- Input type
int- Source default
32- Available options
Not specified in source- Minimum
12- Maximum
100- Step
Not specified in source
What it controls
Forward display length. Closed reference cards disappear after this many bars to avoid projecting stale price zones.
Effect on the script
This controls the visibility, placement, extent or retained history of the documented visual element. It is part of the chart presentation layer.
When to adjust it
Change it when the active reference is hard to inspect or when historical annotations compete with current price action.
Interpretation and limits
Reducing visible history or hiding an element does not improve the underlying observations. A visual projection is not a price forecast.
Original input tooltip
Forward display length. Closed reference cards disappear after this many bars to avoid projecting stale price zones.
Max Markers
- Input type
int- Source default
8- Available options
Not specified in source- Minimum
2- Maximum
30- Step
Not specified in source
What it controls
How many recent completion markers stay on the chart.
Effect on the script
This controls the visibility, placement, extent or retained history of the documented visual element. It is part of the chart presentation layer.
When to adjust it
Change it when the active reference is hard to inspect or when historical annotations compete with current price action.
Interpretation and limits
Reducing visible history or hiding an element does not improve the underlying observations. A visual projection is not a price forecast.
Original input tooltip
How many recent completion markers stay on the chart.
Min Bars Between Markers
- Input type
int- Source default
20- Available options
Not specified in source- Minimum
0- Maximum
200- Step
Not specified in source
What it controls
Minimum bars between visible harmonic-completion markers. Prevents multiple patterns from crowding the same chart area.
Effect on the script
This controls the visibility, placement, extent or retained history of the documented visual element. It is part of the chart presentation layer.
When to adjust it
Change it when the active reference is hard to inspect or when historical annotations compete with current price action.
Interpretation and limits
Reducing visible history or hiding an element does not improve the underlying observations. A visual projection is not a price forecast.
Original input tooltip
Minimum bars between visible harmonic-completion markers. Prevents multiple patterns from crowding the same chart area.
Keep the settings in context
Change one analytical assumption at a time and compare the same instrument, timeframe and history. A chart reference, score, observation rate or input default does not establish a trade fill, a forward probability or a guaranteed outcome.
Return to the product overview · View this script on TradingView