Use your browser’s Find (Ctrl+F / ⌘F) to locate a setting. Open its row for the full explanation and limits. Source-check time is a verification timestamp, not a script publication date.
General settings
22 inputsRequire Later-Candle Reaction
- Input type
bool- Source default
true- Available options
Not specified in source- Minimum
Not specified in source- Maximum
Not specified in source- Step
Not specified in source
What it controls
ON requires a completed reaction candle after the first completed zone-touch candle. OFF permits a same-candle touch and directional reclaim. Both modes require a directional body, midpoint reclaim, minimum score and a completed candle.
Effect on the script
This changes the timing required between the first completed touch and the qualifying reaction or reversal. Other directional, score and boundary gates still apply.
When to adjust it
Choose the timing rule before reviewing examples, according to whether a separate later completed candle is part of your method.
Interpretation and limits
Turning the requirement off does not turn a raw touch or source event into automatic confirmation.
Original input tooltip
ON requires a completed reaction candle after the first completed zone-touch candle. OFF permits a same-candle touch and directional reclaim. Both modes require a directional body, midpoint reclaim, minimum score and a completed candle.
Stable Live Display
- Input type
bool- Source default
true- Available options
Not specified in source- Minimum
Not specified in source- Maximum
Not specified in source- Step
Not specified in source
What it controls
ON holds the last completed-candle state, scores and reason during a developing bar. OFF previews those analytics. Zone creation, lifecycle memory and observation statistics always commit only on completed candles. Price distances remain live and are explicitly labeled.
Effect on the script
This controls whether developing-bar analytics preview live or retain the last completed-candle presentation. The event and observation engine still commits on completed candles.
When to adjust it
Change it when you deliberately want to compare a developing-bar preview with a stable completed-candle display.
Interpretation and limits
A preview is provisional. Turning the preview off does not freeze explicitly live price-distance readouts.
Original input tooltip
ON holds the last completed-candle state, scores and reason during a developing bar. OFF previews those analytics. Zone creation, lifecycle memory and observation statistics always commit only on completed candles. Price distances remain live and are explicitly labeled.
Zone Freshness Limit (Bars)
- Input type
int- Source default
120- Available options
Not specified in source- Minimum
10- Maximum
2000- Step
Not specified in source
What it controls
Unfinished zones older than this limit cannot produce a new reaction confirmation. Previous reaction events remain recorded, while current status becomes Zone Stale. A new qualified source starts a new zone.
Effect on the script
This sets the documented age, waiting period or forward observation deadline used by the event lifecycle.
When to adjust it
Match the review horizon to the question being studied and keep the deadline explicit in historical comparisons.
Interpretation and limits
Changing a deadline changes which observations resolve, expire or remain eligible. A timed model observation is not a broker trade.
Original input tooltip
Unfinished zones older than this limit cannot produce a new reaction confirmation. Previous reaction events remain recorded, while current status becomes Zone Stale. A new qualified source starts a new zone.
Reaction Mode
- Input type
string- Source default
"Auto"- Available options
["Auto", "Bullish Only", "Bearish Only"]- Minimum
Not specified in source- Maximum
Not specified in source- Step
Not specified in source
What it controls
Controls which reaction side the script is allowed to evaluate. Auto allows the most recent qualified bullish or bearish institutional reaction zone.
Effect on the script
This selects which documented analytical mode, source or directional context the workflow evaluates.
When to adjust it
Choose the mode that corresponds to your actual analysis before inspecting historical examples.
Interpretation and limits
A selected direction or model is a configuration choice, not evidence that price must follow it.
Original input tooltip
Controls which reaction side the script is allowed to evaluate. Auto allows the most recent qualified bullish or bearish institutional reaction zone.
Lookback
- Input type
int- Source default
50- Available options
Not specified in source- Minimum
20- Maximum
300- Step
Not specified in source
What it controls
Controls the measurement window for average body size, volatility, and recent structure.
Effect on the script
This changes the observation window or sensitivity of the named calculation feeding the workflow.
When to adjust it
Match the calculation horizon to the analytical question and keep it recorded when comparing results.
Interpretation and limits
Changing the window changes the historical context and can alter warm-up, states and observations. It does not validate a future edge.
Original input tooltip
Controls the measurement window for average body size, volatility, and recent structure.
Pivot Context
- Input type
int- Source default
3- Available options
Not specified in source- Minimum
2- Maximum
10- Step
Not specified in source
What it controls
Controls the local swing context used to qualify reaction candidates.
Effect on the script
This changes the swing or structural reference used by the documented detection or risk-reference calculation.
When to adjust it
Match the swing scale to the structure you intend to inspect, then review the resulting anchors and confirmation timing.
Interpretation and limits
Confirmed pivots require subsequent bars. Different settings create different structure and can change later events and observations.
Original input tooltip
Controls the local swing context used to qualify reaction candidates.
Reaction Sensitivity
- Input type
string- Source default
"Balanced"- Available options
["Relaxed", "Balanced", "Strict"]- Minimum
Not specified in source- Maximum
Not specified in source- Step
Not specified in source
What it controls
Controls how strict the source-candle and reaction-zone qualification should be. Higher sensitivity requires stronger displacement and cleaner source candles.
Effect on the script
This changes how demanding the named qualification, pressure or pattern-fit assessment is.
When to adjust it
Define the selectivity appropriate to the specific structural or flow question before comparing examples.
Interpretation and limits
A more permissive setting can admit marginal context; stricter qualification can delay or exclude events. Neither guarantees better outcomes.
Original input tooltip
Controls how strict the source-candle and reaction-zone qualification should be. Higher sensitivity requires stronger displacement and cleaner source candles.
Zone Width Model
- Input type
string- Source default
"Body"- Available options
["Body", "Wick-Inclusive", "ATR-Padded"]- Minimum
Not specified in source- Maximum
Not specified in source- Step
Not specified in source
What it controls
Controls how the reaction zone is built from the source candle. Body mode is compact, Wick-Inclusive is wider, and ATR-Padded adds volatility padding.
Effect on the script
This supplies the documented value to the associated analytical component.
When to adjust it
Change it when intentionally defining a different analytical assumption, keeping the other settings stable for comparison.
Interpretation and limits
A different configuration changes the model being reviewed; it does not promise a better trading outcome.
Original input tooltip
Controls how the reaction zone is built from the source candle. Body mode is compact, Wick-Inclusive is wider, and ATR-Padded adds volatility padding.
Breaker Confirmation
- Input type
string- Source default
"Balanced"- Available options
["Relaxed", "Balanced", "Strict"]- Minimum
Not specified in source- Maximum
Not specified in source- Step
Not specified in source
What it controls
Controls how strict the breaker transition risk should be when price pressures or closes beyond the active reaction zone.
Effect on the script
This changes how demanding the named qualification, pressure or pattern-fit assessment is.
When to adjust it
Define the selectivity appropriate to the specific structural or flow question before comparing examples.
Interpretation and limits
A more permissive setting can admit marginal context; stricter qualification can delay or exclude events. Neither guarantees better outcomes.
Original input tooltip
Controls how strict the breaker transition risk should be when price pressures or closes beyond the active reaction zone.
Invalidation Strictness
- Input type
string- Source default
"Balanced"- Available options
["Relaxed", "Balanced", "Strict"]- Minimum
Not specified in source- Maximum
Not specified in source- Step
Not specified in source
What it controls
Controls how quickly invalidation pressure increases as price moves beyond the reaction boundary.
Effect on the script
This changes how demanding the named qualification, pressure or pattern-fit assessment is.
When to adjust it
Define the selectivity appropriate to the specific structural or flow question before comparing examples.
Interpretation and limits
A more permissive setting can admit marginal context; stricter qualification can delay or exclude events. Neither guarantees better outcomes.
Original input tooltip
Controls how quickly invalidation pressure increases as price moves beyond the reaction boundary.
Zone Reach (ATR)
- Input type
float- Source default
3.0- Available options
Not specified in source- Minimum
1.0- Maximum
8.0- Step
0.5
What it controls
Controls how many source-ATRs price may sit away from the active zone before the workflow switches to a distant standby state instead of an active reaction wait.
Effect on the script
This changes the documented volatility, risk-distance or location reference used by the analytical workflow.
When to adjust it
Set the relevant risk or distance assumption as part of a coherent plan, then inspect the resulting geometry.
Interpretation and limits
A chart reference is not an account-risk limit, a live stop or a guarantee of execution. Gaps and changing volatility can exceed the reference.
Original input tooltip
Controls how many source-ATRs price may sit away from the active zone before the workflow switches to a distant standby state instead of an active reaction wait.
Minimum Label Score
- Input type
int- Source default
75- Available options
Not specified in source- Minimum
60- Maximum
95- Step
Not specified in source
What it controls
Hides historical chart labels below this score while keeping the active zone, current command card, panel, and alerts active.
Effect on the script
This filters the labels drawn on the chart; the internal workflow, dashboard and alert logic remain active.
When to adjust it
Change it when the active reference is hard to inspect or when historical annotations compete with current price action.
Interpretation and limits
A missing lower-score label does not mean that its analytical context or alert conditions have been disabled.
Original input tooltip
Hides historical chart labels below this score while keeping the active zone, current command card, panel, and alerts active.
Zone Projection Bars
- Input type
int- Source default
48- Available options
Not specified in source- Minimum
20- Maximum
250- Step
Not specified in source
What it controls
Controls how far the active reaction zone is projected to the right. The script caps this projection on weekly and monthly charts for cleaner publication screenshots.
Effect on the script
This controls the visibility, placement, extent or retained history of the documented visual element. It is part of the chart presentation layer.
When to adjust it
Change it when the active reference is hard to inspect or when historical annotations compete with current price action.
Interpretation and limits
Reducing visible history or hiding an element does not improve the underlying observations. A visual projection is not a price forecast.
Original input tooltip
Controls how far the active reaction zone is projected to the right. The script caps this projection on weekly and monthly charts for cleaner publication screenshots.
Visual Preset
- Input type
string- Source default
"Balanced"- Available options
["Clean", "Balanced", "Rich"]- Minimum
Not specified in source- Maximum
Not specified in source- Step
Not specified in source
What it controls
Controls chart annotation density. Balanced keeps the current zone readable while limiting historical label clutter.
Effect on the script
This controls the visibility, placement, extent or retained history of the documented visual element. It is part of the chart presentation layer.
When to adjust it
Change it when the active reference is hard to inspect or when historical annotations compete with current price action.
Interpretation and limits
Reducing visible history or hiding an element does not improve the underlying observations. A visual projection is not a price forecast.
Original input tooltip
Controls chart annotation density. Balanced keeps the current zone readable while limiting historical label clutter.
Publication Mode
- Input type
bool- Source default
true- Available options
Not specified in source- Minimum
Not specified in source- Maximum
Not specified in source- Step
Not specified in source
What it controls
Optimizes the chart for clean publication screenshots by reducing repeated historical labels, improving active-zone wording, and consolidating the current reaction context into one command card.
Effect on the script
This controls the visibility, placement, extent or retained history of the documented visual element. It is part of the chart presentation layer.
When to adjust it
Change it when the active reference is hard to inspect or when historical annotations compete with current price action.
Interpretation and limits
Reducing visible history or hiding an element does not improve the underlying observations. A visual projection is not a price forecast.
Original input tooltip
Optimizes the chart for clean publication screenshots by reducing repeated historical labels, improving active-zone wording, and consolidating the current reaction context into one command card.
History Labels
- Input type
string- Source default
"Curated"- Available options
["Curated", "Minimal", "Rich"]- Minimum
Not specified in source- Maximum
Not specified in source- Step
Not specified in source
What it controls
Controls historical state labels. Curated keeps only selected context labels, Minimal hides them, and Rich shows more historical state changes.
Effect on the script
This controls the visibility, placement, extent or retained history of the documented visual element. It is part of the chart presentation layer.
When to adjust it
Change it when the active reference is hard to inspect or when historical annotations compete with current price action.
Interpretation and limits
Reducing visible history or hiding an element does not improve the underlying observations. A visual projection is not a price forecast.
Original input tooltip
Controls historical state labels. Curated keeps only selected context labels, Minimal hides them, and Rich shows more historical state changes.
State Label Cooldown
- Input type
int- Source default
55- Available options
Not specified in source- Minimum
50- Maximum
180- Step
Not specified in source
What it controls
Controls the minimum number of bars between historical state labels. Higher values keep the chart cleaner on lower timeframes.
Effect on the script
This controls the visibility, placement, extent or retained history of the documented visual element. It is part of the chart presentation layer.
When to adjust it
Change it when the active reference is hard to inspect or when historical annotations compete with current price action.
Interpretation and limits
Reducing visible history or hiding an element does not improve the underlying observations. A visual projection is not a price forecast.
Original input tooltip
Controls the minimum number of bars between historical state labels. Higher values keep the chart cleaner on lower timeframes.
Label Font Size
- Input type
string- Source default
"Normal"- Available options
["Small", "Normal", "Large"]- Minimum
Not specified in source- Maximum
Not specified in source- Step
Not specified in source
What it controls
Controls visible chart label size.
Effect on the script
This changes presentation and legibility of the relevant chart element, rather than the underlying analytical model.
When to adjust it
Change it when the chart background, screen size or other overlays make the current presentation difficult to read.
Interpretation and limits
A visual preference does not strengthen the measured setup or alter its uncertainty.
Original input tooltip
Controls visible chart label size.
Show Panel
- Input type
bool- Source default
true- Available options
Not specified in source- Minimum
Not specified in source- Maximum
Not specified in source- Step
Not specified in source
What it controls
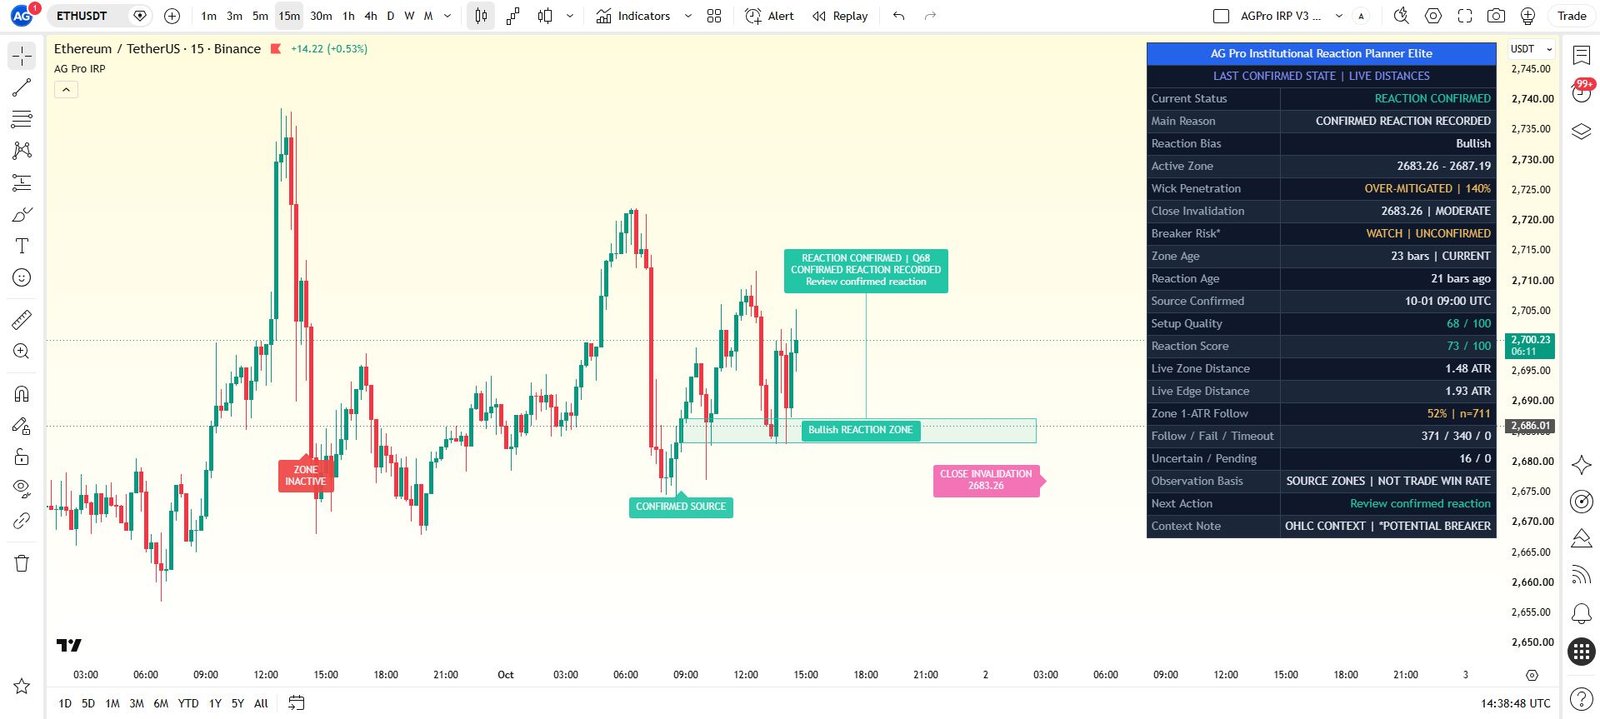
Shows or hides the AGPro workflow panel. The panel summarizes zone side, mitigation, reaction state, breaker risk, invalidation pressure, bars active, follow rate, setup quality, reaction score, distance, and next action.
Effect on the script
This controls the visibility, placement, extent or retained history of the documented visual element. It is part of the chart presentation layer.
When to adjust it
Change it when the active reference is hard to inspect or when historical annotations compete with current price action.
Interpretation and limits
Reducing visible history or hiding an element does not improve the underlying observations. A visual projection is not a price forecast.
Original input tooltip
Shows or hides the AGPro workflow panel. The panel summarizes zone side, mitigation, reaction state, breaker risk, invalidation pressure, bars active, follow rate, setup quality, reaction score, distance, and next action.
Panel Location
- Input type
string- Source default
"Top Right"- Available options
["Top Right", "Top Left", "Bottom Right", "Bottom Left"]- Minimum
Not specified in source- Maximum
Not specified in source- Step
Not specified in source
What it controls
Sets panel location within the current controls.
Effect on the script
This changes presentation and legibility of the relevant chart element, rather than the underlying analytical model.
When to adjust it
Change it when the chart background, screen size or other overlays make the current presentation difficult to read.
Interpretation and limits
A visual preference does not strengthen the measured setup or alter its uncertainty.
Panel Theme
- Input type
string- Source default
"Dark"- Available options
["Dark", "Light"]- Minimum
Not specified in source- Maximum
Not specified in source- Step
Not specified in source
What it controls
Sets panel theme within the current controls.
Effect on the script
This changes presentation and legibility of the relevant chart element, rather than the underlying analytical model.
When to adjust it
Change it when the chart background, screen size or other overlays make the current presentation difficult to read.
Interpretation and limits
A visual preference does not strengthen the measured setup or alter its uncertainty.
Panel Font Size
- Input type
string- Source default
"Normal"- Available options
["Small", "Normal", "Large"]- Minimum
Not specified in source- Maximum
Not specified in source- Step
Not specified in source
What it controls
Sets panel font size within the current controls.
Effect on the script
This changes presentation and legibility of the relevant chart element, rather than the underlying analytical model.
When to adjust it
Change it when the chart background, screen size or other overlays make the current presentation difficult to read.
Interpretation and limits
A visual preference does not strengthen the measured setup or alter its uncertainty.
Keep the settings in context
Change one analytical assumption at a time and compare the same instrument, timeframe and history. A chart reference, score, observation rate or input default does not establish a trade fill, a forward probability or a guaranteed outcome.
Return to the product overview · View this script on TradingView