Use your browser’s Find (Ctrl+F / ⌘F) to locate a setting. Open its row for the full explanation and limits. Source-check time is a verification timestamp, not a script publication date.
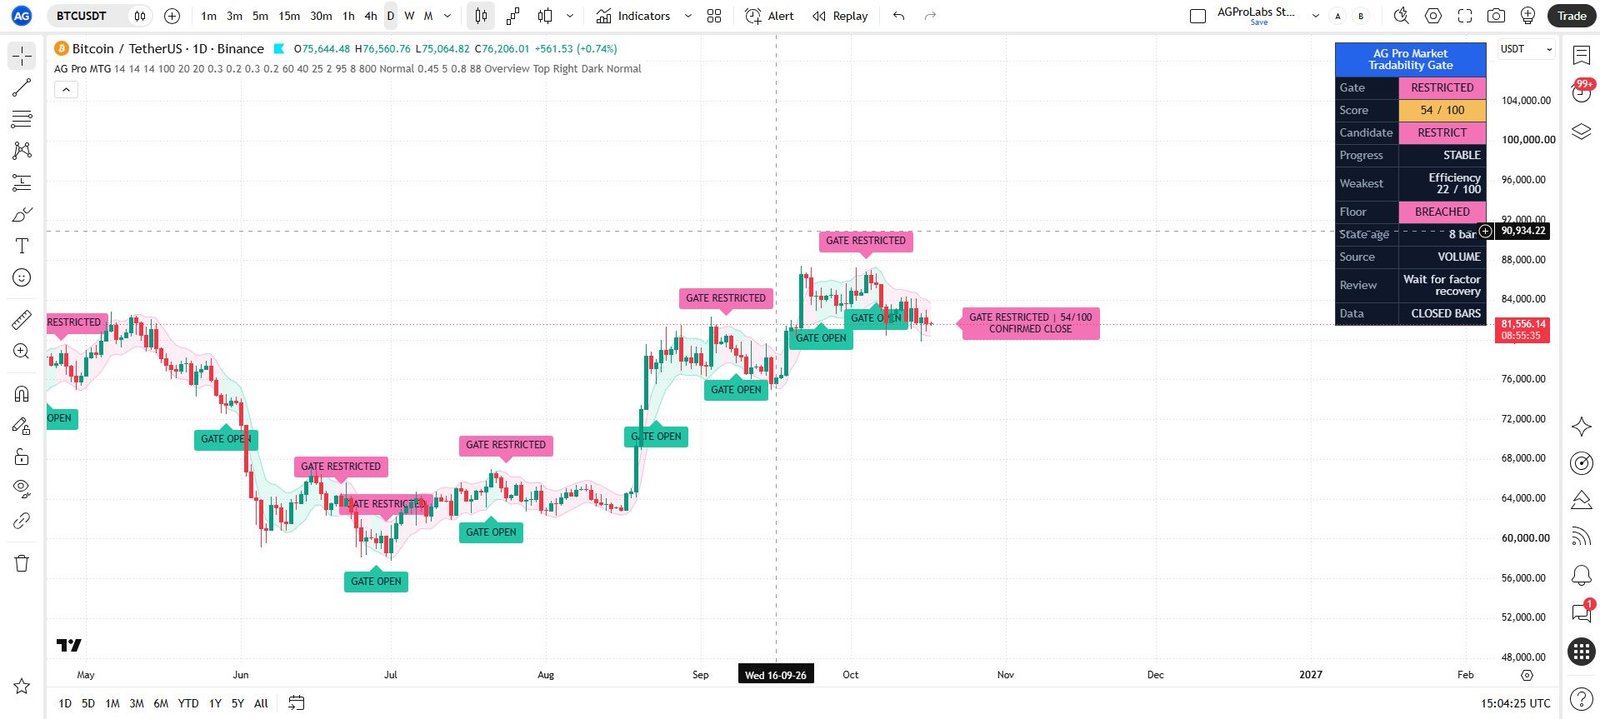
Factors
6 inputsADX / DI length
- Input type
int- Source default
14- Available options
Not specified in source- Minimum
2- Maximum
100- Step
Not specified in source
What it controls
Controls the measurement window for directional trend clarity.
Effect on the script
Applies this parameter to the component and behavior stated in its source tooltip.
When to adjust it
Change it only when the specific analytical or presentation question in the tooltip changes.
Interpretation and limits
Record the configuration when comparing observations; a changed setting is not proof of a stronger future result.
Original input tooltip
Controls the measurement window for directional trend clarity.
ADX smoothing
- Input type
int- Source default
14- Available options
Not specified in source- Minimum
1- Maximum
100- Step
Not specified in source
What it controls
Smooths the ADX component used by the trend score.
Effect on the script
Applies this parameter to the component and behavior stated in its source tooltip.
When to adjust it
Change it only when the specific analytical or presentation question in the tooltip changes.
Interpretation and limits
Record the configuration when comparing observations; a changed setting is not proof of a stronger future result.
Original input tooltip
Smooths the ADX component used by the trend score.
ATR length
- Input type
int- Source default
14- Available options
Not specified in source- Minimum
1- Maximum
100- Step
Not specified in source
What it controls
Controls the ATR window used to normalize current volatility.
Effect on the script
Changes the ATR measurement window used by the documented volatility and distance calculations.
When to adjust it
Adjust it only when deliberately comparing a different volatility baseline.
Interpretation and limits
A different ATR unit changes the reference context; it does not make adverse price movement safely bounded.
Original input tooltip
Controls the ATR window used to normalize current volatility.
Volatility reference length
- Input type
int- Source default
100- Available options
Not specified in source- Minimum
20- Maximum
500- Step
Not specified in source
What it controls
Defines the historical ATR-percent baseline used to judge whether current volatility is unusually quiet or erratic.
Effect on the script
Applies this parameter to the component and behavior stated in its source tooltip.
When to adjust it
Change it only when the specific analytical or presentation question in the tooltip changes.
Interpretation and limits
Record the configuration when comparing observations; a changed setting is not proof of a stronger future result.
Original input tooltip
Defines the historical ATR-percent baseline used to judge whether current volatility is unusually quiet or erratic.
Efficiency length
- Input type
int- Source default
20- Available options
Not specified in source- Minimum
2- Maximum
200- Step
Not specified in source
What it controls
Controls the Kaufman Efficiency Ratio window: net movement divided by total movement.
Effect on the script
Applies this parameter to the component and behavior stated in its source tooltip.
When to adjust it
Change it only when the specific analytical or presentation question in the tooltip changes.
Interpretation and limits
Record the configuration when comparing observations; a changed setting is not proof of a stronger future result.
Original input tooltip
Controls the Kaufman Efficiency Ratio window: net movement divided by total movement.
Participation length
- Input type
int- Source default
20- Available options
Not specified in source- Minimum
2- Maximum
200- Step
Not specified in source
What it controls
Controls the relative-volume window.
Effect on the script
Missing volume or an all-zero volume baseline uses relative range as an explicit proxy. A zero-volume bar against a positive volume baseline scores zero. Neither source measures order-book liquidity or spreads.
When to adjust it
Change it only when the specific analytical or presentation question in the tooltip changes.
Interpretation and limits
Record the configuration when comparing observations; a changed setting is not proof of a stronger future result.
Original input tooltip
Controls the relative-volume window. Missing volume or an all-zero volume baseline uses relative range as an explicit proxy. A zero-volume bar against a positive volume baseline scores zero. Neither source measures order-book liquidity or spreads.
Weights
4 inputsTrend weight
- Input type
float- Source default
0.3- Available options
Not specified in source- Minimum
0.0- Maximum
1.0- Step
0.05
What it controls
Contribution of trend clarity to the composite Tradability score.
Effect on the script
Applies this parameter to the component and behavior stated in its source tooltip.
When to adjust it
Change it only when the specific analytical or presentation question in the tooltip changes.
Interpretation and limits
Record the configuration when comparing observations; a changed setting is not proof of a stronger future result.
Original input tooltip
Contribution of trend clarity to the composite Tradability score.
Volatility weight
- Input type
float- Source default
0.2- Available options
Not specified in source- Minimum
0.0- Maximum
1.0- Step
0.05
What it controls
Contribution of volatility adequacy to the composite Tradability score.
Effect on the script
Applies this parameter to the component and behavior stated in its source tooltip.
When to adjust it
Change it only when the specific analytical or presentation question in the tooltip changes.
Interpretation and limits
Record the configuration when comparing observations; a changed setting is not proof of a stronger future result.
Original input tooltip
Contribution of volatility adequacy to the composite Tradability score.
Efficiency weight
- Input type
float- Source default
0.3- Available options
Not specified in source- Minimum
0.0- Maximum
1.0- Step
0.05
What it controls
Contribution of directional efficiency to the composite Tradability score.
Effect on the script
Applies this parameter to the component and behavior stated in its source tooltip.
When to adjust it
Change it only when the specific analytical or presentation question in the tooltip changes.
Interpretation and limits
Record the configuration when comparing observations; a changed setting is not proof of a stronger future result.
Original input tooltip
Contribution of directional efficiency to the composite Tradability score.
Participation weight
- Input type
float- Source default
0.2- Available options
Not specified in source- Minimum
0.0- Maximum
1.0- Step
0.05
What it controls
Contribution of volume or range participation to the composite Tradability score.
Effect on the script
Applies this parameter to the component and behavior stated in its source tooltip.
When to adjust it
Change it only when the specific analytical or presentation question in the tooltip changes.
Interpretation and limits
Record the configuration when comparing observations; a changed setting is not proof of a stronger future result.
Original input tooltip
Contribution of volume or range participation to the composite Tradability score.
Thresholds
4 inputsGate opens at / above
- Input type
int- Source default
60- Available options
Not specified in source- Minimum
30- Maximum
90- Step
Not specified in source
What it controls
Confirmed scores at or above this level open the gate.
Effect on the script
If this conflicts with the restriction threshold, the script automatically preserves a one-point ordered buffer.
When to adjust it
Change it only when the specific analytical or presentation question in the tooltip changes.
Interpretation and limits
Record the configuration when comparing observations; a changed setting is not proof of a stronger future result.
Original input tooltip
Confirmed scores at or above this level open the gate. If this conflicts with the restriction threshold, the script automatically preserves a one-point ordered buffer.
Gate restricts below
- Input type
int- Source default
40- Available options
Not specified in source- Minimum
10- Maximum
70- Step
Not specified in source
What it controls
Confirmed scores below this level restrict the gate.
Effect on the script
The open threshold is always kept above this level.
When to adjust it
Change it only when the specific analytical or presentation question in the tooltip changes.
Interpretation and limits
Record the configuration when comparing observations; a changed setting is not proof of a stronger future result.
Original input tooltip
Confirmed scores below this level restrict the gate. The open threshold is always kept above this level.
Critical factor floor
- Input type
int- Source default
25- Available options
Not specified in source- Minimum
0- Maximum
60- Step
Not specified in source
What it controls
Prevents the gate from opening when any confirmed factor falls below this minimum.
Effect on the script
The floor applies to all four factors, including factors with zero composite weight. A restriction still requires the configured consecutive closes. Set to 0 to disable the floor.
When to adjust it
Change it only when the specific analytical or presentation question in the tooltip changes.
Interpretation and limits
Record the configuration when comparing observations; a changed setting is not proof of a stronger future result.
Original input tooltip
Prevents the gate from opening when any confirmed factor falls below this minimum. The floor applies to all four factors, including factors with zero composite weight. A restriction still requires the configured consecutive closes. Set to 0 to disable the floor.
Transition confirmation bars
- Input type
int- Source default
2- Available options
Not specified in source- Minimum
1- Maximum
10- Step
Not specified in source
What it controls
Requires this many consecutive confirmed qualifying bars before the gate changes to Open or Restricted.
Effect on the script
Applies this parameter to the component and behavior stated in its source tooltip.
When to adjust it
Change it only when the specific analytical or presentation question in the tooltip changes.
Interpretation and limits
Record the configuration when comparing observations; a changed setting is not proof of a stronger future result.
Original input tooltip
Requires this many consecutive confirmed qualifying bars before the gate changes to Open or Restricted.
Visuals
8 inputsRegime background tint
- Input type
bool- Source default
false- Available options
Not specified in source- Minimum
Not specified in source- Maximum
Not specified in source- Step
Not specified in source
What it controls
Optionally shows the confirmed gate memory across the recent visual-history window.
Effect on the script
Disabled by default to minimize background rendering load.
When to adjust it
Toggle it to inspect that element or make space for the current chart review.
Interpretation and limits
A visibility switch does not turn a visual reference into an executed order or validated result.
Original input tooltip
Optionally shows the confirmed gate memory across the recent visual-history window. Disabled by default to minimize background rendering load.
Background tint transparency
- Input type
int- Source default
95- Available options
Not specified in source- Minimum
85- Maximum
100- Step
Not specified in source
What it controls
Controls the opacity of the confirmed regime tint.
Effect on the script
Higher values keep candles and price structure more prominent.
When to adjust it
Adjust it when the relevant zone or state is difficult to see against the chart background.
Interpretation and limits
Contrast changes do not strengthen the underlying signal, observation, or market structure.
Original input tooltip
Controls the opacity of the confirmed regime tint. Higher values keep candles and price structure more prominent.
Transition markers
- Input type
bool- Source default
true- Available options
Not specified in source- Minimum
Not specified in source- Maximum
Not specified in source- Step
Not specified in source
What it controls
Shows confirmed transitions into Open and Restricted states.
Effect on the script
Controls visibility of the chart element named by this setting.
When to adjust it
Toggle it to inspect that element or make space for the current chart review.
Interpretation and limits
A visibility switch does not turn a visual reference into an executed order or validated result.
Original input tooltip
Shows confirmed transitions into Open and Restricted states.
On-chart gate badge
- Input type
bool- Source default
true- Available options
Not specified in source- Minimum
Not specified in source- Maximum
Not specified in source- Step
Not specified in source
What it controls
Shows the latest confirmed gate state and Tradability score beside price.
Effect on the script
Controls visibility of the chart element named by this setting.
When to adjust it
Toggle it to inspect that element or make space for the current chart review.
Interpretation and limits
A visibility switch does not turn a visual reference into an executed order or validated result.
Original input tooltip
Shows the latest confirmed gate state and Tradability score beside price.
Min bars between same-state markers
- Input type
int- Source default
8- Available options
Not specified in source- Minimum
1- Maximum
100- Step
Not specified in source
What it controls
Limits repeated markers of the same type.
Effect on the script
An opposite transition is not blocked by the prior state's cooldown.
When to adjust it
Change it only when the specific analytical or presentation question in the tooltip changes.
Interpretation and limits
An opposite transition is not blocked by the prior state's cooldown.
Original input tooltip
Limits repeated markers of the same type. An opposite transition is not blocked by the prior state's cooldown.
Transition history (bars)
- Input type
int- Source default
800- Available options
Not specified in source- Minimum
100- Maximum
5000- Step
Not specified in source
What it controls
Limits premium transition labels to recent chart history.
Effect on the script
A bounded window materially reduces initial chart-render work on long histories.
When to adjust it
Change it only when the specific analytical or presentation question in the tooltip changes.
Interpretation and limits
Record the configuration when comparing observations; a changed setting is not proof of a stronger future result.
Original input tooltip
Limits premium transition labels to recent chart history. A bounded window materially reduces initial chart-render work on long histories.
Label size
- Input type
string- Source default
"Normal"- Available options
["Tiny", "Small", "Normal", "Large"]- Minimum
Not specified in source- Maximum
Not specified in source- Step
Not specified in source
What it controls
Controls the font size of transition labels and the current gate badge.
Effect on the script
Controls the text-size mapping used by the relevant panel or chart-label renderer.
When to adjust it
Adjust it for the chart size and viewing distance while preserving readable boundaries and state information.
Interpretation and limits
A larger font can increase chart overlap. Text size does not change the analytical observations.
Original input tooltip
Controls the font size of transition labels and the current gate badge.
Label distance (ATR)
- Input type
float- Source default
0.45- Available options
Not specified in source- Minimum
0.1- Maximum
2.0- Step
0.05
What it controls
Offsets event labels beyond the three-bar local high or low.
Effect on the script
Increase only when the selected font or chart zoom needs additional space.
When to adjust it
Change it only when the specific analytical or presentation question in the tooltip changes.
Interpretation and limits
Record the configuration when comparing observations; a changed setting is not proof of a stronger future result.
Original input tooltip
Offsets event labels beyond the three-bar local high or low. Increase only when the selected font or chart zoom needs additional space.
Gate Context Band
4 inputsShow context band
- Input type
bool- Source default
true- Available options
Not specified in source- Minimum
Not specified in source- Maximum
Not specified in source- Step
Not specified in source
What it controls
Shows a subtle price-following envelope colored by the confirmed gate state.
Effect on the script
Visual context only: not support, resistance, a trade zone or a volatility probability interval. Its geometry follows the live candle; gate colors change only on confirmed data.
When to adjust it
Toggle it to inspect that element or make space for the current chart review.
Interpretation and limits
A visibility switch does not turn a visual reference into an executed order or validated result.
Original input tooltip
Shows a subtle price-following envelope colored by the confirmed gate state. Visual context only: not support, resistance, a trade zone or a volatility probability interval. Its geometry follows the live candle; gate colors change only on confirmed data.
Band smoothing
- Input type
int- Source default
5- Available options
Not specified in source- Minimum
1- Maximum
50- Step
Not specified in source
What it controls
EMA smoothing of the candle midpoint.
Effect on the script
Lower values follow price more closely. This setting affects only the band.
When to adjust it
Change it only when the specific analytical or presentation question in the tooltip changes.
Interpretation and limits
Record the configuration when comparing observations; a changed setting is not proof of a stronger future result.
Original input tooltip
EMA smoothing of the candle midpoint. Lower values follow price more closely. This setting affects only the band.
Band half-width (ATR)
- Input type
float- Source default
0.8- Available options
Not specified in source- Minimum
0.2- Maximum
2.0- Step
0.1
What it controls
Distance of each boundary from the smoothed midpoint, measured in the existing ATR.
Effect on the script
The band does not guarantee containment of candle bodies or wicks.
When to adjust it
Change it only when the specific analytical or presentation question in the tooltip changes.
Interpretation and limits
The band does not guarantee containment of candle bodies or wicks.
Original input tooltip
Distance of each boundary from the smoothed midpoint, measured in the existing ATR. The band does not guarantee containment of candle bodies or wicks.
Band transparency
- Input type
int- Source default
88- Available options
Not specified in source- Minimum
85- Maximum
98- Step
Not specified in source
What it controls
Higher values make the fill more subtle.
Effect on the script
The default keeps candles and event labels prominent.
When to adjust it
Adjust it when the relevant zone or state is difficult to see against the chart background.
Interpretation and limits
Contrast changes do not strengthen the underlying signal, observation, or market structure.
Original input tooltip
Higher values make the fill more subtle. The default keeps candles and event labels prominent.
Decision Panel
5 inputsPanel page
- Input type
string- Source default
"Overview"- Available options
["Overview", "Factors"]- Minimum
Not specified in source- Maximum
Not specified in source- Step
Not specified in source
What it controls
Overview separates the confirmed gate from the pending candidate.
Effect on the script
Factors shows the component scores, participation source and effective thresholds.
When to adjust it
Use the current-state view for orientation and the available evidence/audit view when checking observation provenance and exclusions.
Interpretation and limits
A compact or hidden view does not remove the limitations of the underlying observations.
Original input tooltip
Overview separates the confirmed gate from the pending candidate. Factors shows the component scores, participation source and effective thresholds.
Show panel
- Input type
bool- Source default
true- Available options
Not specified in source- Minimum
Not specified in source- Maximum
Not specified in source- Step
Not specified in source
What it controls
Shows the confirmed Tradability decision panel.
Effect on the script
Controls whether the workflow table is rendered on the chart.
When to adjust it
Show the panel to inspect the state and evidence, or hide it when chart space is the immediate priority.
Interpretation and limits
Hiding the panel is a presentation choice; do not treat missing rows as missing risk.
Original input tooltip
Shows the confirmed Tradability decision panel.
Panel position
- Input type
string- Source default
"Top Right"- Available options
["Top Right", "Top Left", "Bottom Right", "Bottom Left", "Middle Right"]- Minimum
Not specified in source- Maximum
Not specified in source- Step
Not specified in source
What it controls
Moves the decision panel without changing the model.
Effect on the script
Selects the table position used by the panel renderer.
When to adjust it
Move the panel when it overlaps active candles, the current workflow zone, or reference labels.
Interpretation and limits
Panel placement changes presentation, not the detected context or observation accounting.
Original input tooltip
Moves the decision panel without changing the model.
Theme
- Input type
string- Source default
"Dark"- Available options
["Dark", "Light"]- Minimum
Not specified in source- Maximum
Not specified in source- Step
Not specified in source
What it controls
Selects a contrast-safe dark or light panel theme.
Effect on the script
Selects the panel background, border, and text color scheme used for contrast.
When to adjust it
Choose the available theme that keeps the panel readable against the chart background.
Interpretation and limits
A theme changes appearance; it does not change event qualification or statistical evidence.
Original input tooltip
Selects a contrast-safe dark or light panel theme.
Panel font size
- Input type
string- Source default
"Normal"- Available options
["Tiny", "Small", "Normal", "Large"]- Minimum
Not specified in source- Maximum
Not specified in source- Step
Not specified in source
What it controls
Controls the font size of all panel rows.
Effect on the script
Controls the text-size mapping used by the relevant panel or chart-label renderer.
When to adjust it
Adjust it for the chart size and viewing distance while preserving readable boundaries and state information.
Interpretation and limits
A larger font can increase chart overlap. Text size does not change the analytical observations.
Original input tooltip
Controls the font size of all panel rows.
Keep the settings in context
Change one analytical assumption at a time and compare the same instrument, timeframe and history. A chart reference, score, observation rate or input default does not establish a trade fill, a forward probability or a guaranteed outcome.
Return to the product overview · View this script on TradingView