

Market condition checks
TradingView Pine Script Workflow
Market Tradability Gate [AGPro Series]
5-Year Access, one-time payment. Manual TradingView activation. TradingView and data fees are separate.
Get Access — $149$149.00
Check whether conditions deserve attention before choosing a direction.
Inspect the environment before a directional setup review. Four component readings and a weighted diagnostic reveal whether trend clarity, volatility, efficiency or participation is limiting the model's gate.
- One focused workflow
- 5-Year Access · one-time
- Manual TradingView activation
Already paid through Whop? Get TradingView access help
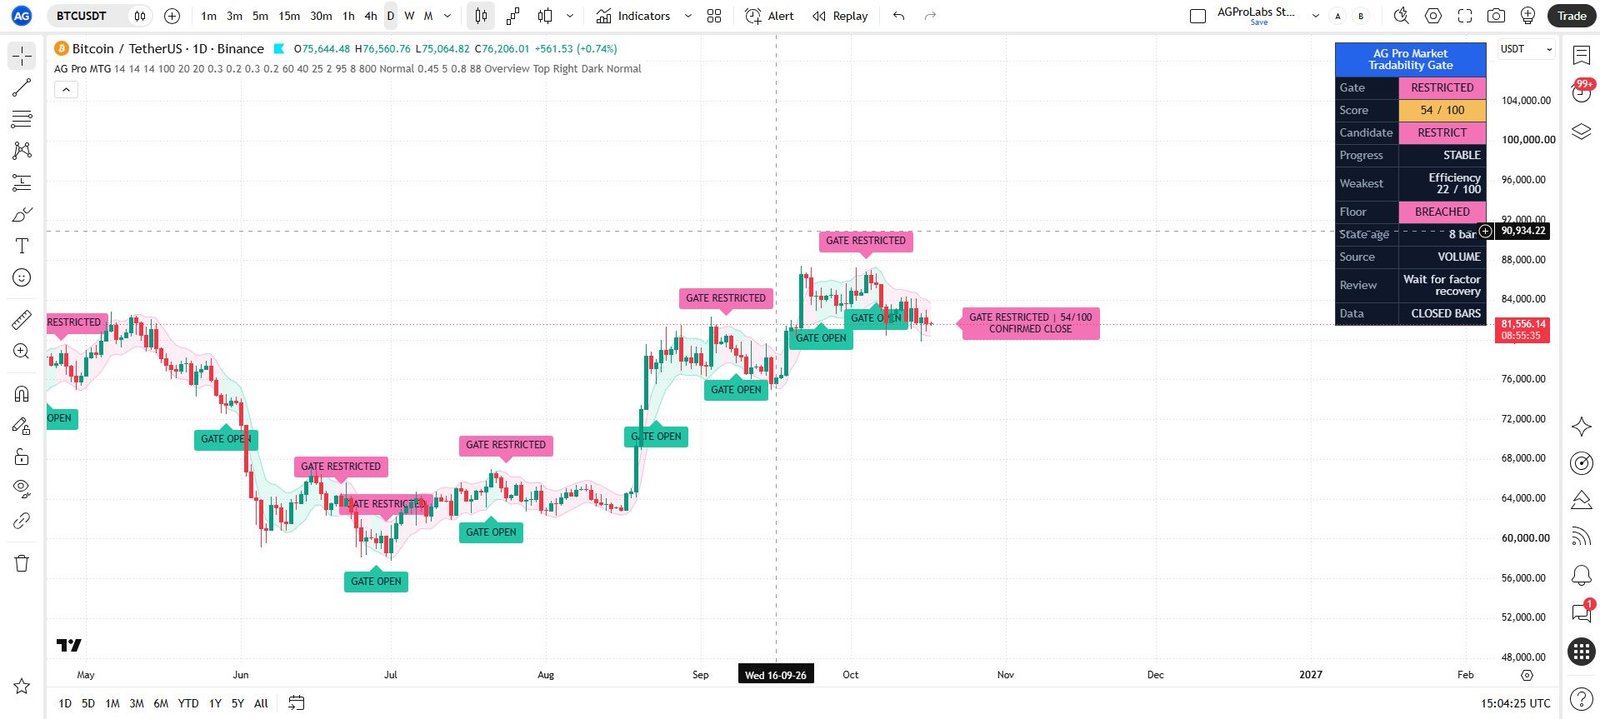
View actual chart & all settings First gallery image: historical TradingView interface. Second image: illustrative cover. Open the gallery to inspect details.
Manual TradingView activation
Submit the exact TradingView username at checkout. Manual review begins after verified payment; access confirmation follows when activation is complete.
One-time payment. No subscription. Available payment methods are shown before order placement.
Need help before purchase? Ask AGProLabs →
Inside Market Tradability Gate
Check whether conditions deserve attention before choosing a direction.
Market Tradability Gate evaluates the environment independently of bullish or bearish preference. It combines trend clarity, volatility adequacy, efficiency, and participation into a 0–100 Tradability score, then identifies the weakest component. Open, Review, and Restricted states give the conditions review a clear structure while Overview and Factors separate the held gate, candidate, critical floor and underlying measurements. The purpose is disciplined screening of the chart environment, not prediction of price direction or an assurance that an open gate makes a trade profitable.
Choose with a clear purpose
What this workflow helps you inspect.
For traders who want a conditions layer before their setup analysis, especially when noise or participation makes a chart harder to interpret.
- Assess chart conditions independently of a bullish or bearish preference.
- Identify the weakest component instead of relying on a composite score alone.
- Keep observed volume participation distinct from the documented range-based fallback.
Read the detailed workflow fit
- For users who want a conditions layer before applying their own setup logic. It is relevant when chop, thin participation, inadequate range, or erratic volatility undermine an otherwise attractive chart idea. The weakest-link field is particularly useful for understanding why the composite remains mixed instead of interpreting one strong factor as sufficient evidence.
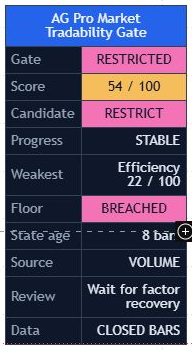 Inspect interface detail
Trend clarity and directional efficiency
Price can travel back and forth even when occasional moves look strongly directional.
Volatility adequacy
Very quiet and wildly erratic conditions can create different problems for the same setup.
Participation with a documented fallback
A chart can appear orderly while participation is weak or unavailable in the source data.
See what each layer contributes.
Open a module to explore its purpose, practical interpretation and boundaries. Examples describe a review process; they are not promises of a trading result.
01Trend clarity and directional efficiencyPrice can travel back and forth even when occasional moves look strongly directional.
Trend clarity uses ADX-related directional strength, while efficiency uses the Kaufman Efficiency Ratio: net movement divided by the total traveled path. These are separate observations. A clean directional journey and a noisy route with the same final displacement need not receive the same efficiency reading, making the quality of travel visible alongside trend strength.
A practical reading
Inspect the efficiency component when an apparently directional chart has accumulated substantial back-and-forth movement.
Keep in view: Neither component predicts the next direction, and both depend on recent data windows.
02Volatility adequacyVery quiet and wildly erratic conditions can create different problems for the same setup.
ATR percentage is judged relative to its recent normal. The component is intended to distinguish adequate movement from conditions that are too quiet or unusually erratic. This adds a different question from direction: even when a directional thesis exists, is the current movement environment aligned with the user's independent planning requirements?
A practical reading
A strong directional factor can coexist with weaker volatility adequacy when the recent movement profile is abnormal.
Keep in view: This does not calculate your actual spread, fees, slippage, or minimum executable trade economics.
03Participation with a documented fallbackA chart can appear orderly while participation is weak or unavailable in the source data.
Relative volume supplies context when the current nonnegative volume has a positive baseline. Missing volume or an all-zero baseline uses relative range; a zero-volume bar against a positive baseline scores zero. Making this distinction explicit prevents a proxy reading from being mistaken for observed trading activity. Participation is one contributor to the gate, rather than an independent proof that a market is liquid enough for a particular order size.
A practical reading
Check whether a no-volume symbol is using the range-based approximation before comparing it with a volume-bearing instrument.
Keep in view: The fallback is an approximation and does not become real volume or exchange depth.
04Composite, weakest link, and state visibilityA single headline score can hide the factor that is holding conditions back.
The four components form a weighted score, with the weakest factor disclosed. An enabled critical floor applies to all four factors, including a zero-weight component, and blocks an Open candidate when breached. The gate holds confirmed OPEN, REVIEW, or RESTRICTED context and distinguishes a pending candidate zone from the held state. Completed-bar confirmation and buffer behavior prevent a changing score alone from being presented as an immediate gate transition.
A practical reading
A favorable composite should still be inspected beside the weakest factor to understand what remains constrained.
Keep in view: Open, Review, and Restricted are confirmed model states. They do not authorize a trade or establish suitability for a particular account.
Understand the controls before changing them.
Explore the main controls and control groups below. Read the current TradingView Inputs and tooltips for the available values; choose a consistent configuration before reviewing its results.
Factor lengths
Set the ADX, ATR, efficiency, and participation measurement windows.
When to adjust
When deliberately comparing different recent-data horizons.
Watch for
A window change alters the evidence represented by the component.
Weights
Set each factor's contribution to the composite score.
When to adjust
When transparently testing which condition assumptions matter to the review.
Watch for
Increasing a favored factor’s weight can lift the score without improving the market. Setting a weight to zero does not disable that component’s critical floor.
Thresholds
Define the candidate Open and Restricted score zones; completed-bar confirmation and buffer behavior determine changes in the held gate state.
When to adjust
To examine classification sensitivity for a stated workflow.
Watch for
A more permissive gate is not proof of better trading conditions.
Regime tint and transition markers
Control the visible background state and sparse state-change markers.
When to adjust
When adapting the presentation to chart contrast and review needs.
Watch for
A transition marker is not an executed trade or a performance result.
Marker spacing and gate badge
Control transition annotation spacing and the latest confirmed gate/score badge with pending or buffer context.
When to adjust
When repeated state changes clutter the chart.
Watch for
Hiding intermediate annotations should not obscure an unstable regime.
Theme, position, and font size
Control the panel's readability and placement.
When to adjust
To keep Overview and Factors pages readable alongside price action.
Watch for
Read the components as well as the composite number.
Complete settings reference
Open complete settings reference
Every setting, explained.
Explore each input, its source default, available choices and practical effect before changing your configuration.
The reference shows defaults in the verified source. A preset or saved chart can retain different input values. Chart captures illustrate the interface and are not a live signal or a performance record.
From first look to a documented observation.
- Read the current state without first imposing a bullish or bearish preference on the chart.
- Inspect all four factor cells and identify the weakest link behind the composite.
- Check whether participation is based on volume or the range fallback, and consider whether the factor windows match the study.
- Use the conditions review alongside independent setup and risk criteria, reassessing after regime transitions instead of treating an open gate as permanent.
Answers specific to this workflow.
Does an Open gate mean I should buy or sell?
No. The tool is direction-independent and reviews conditions. A gate opening does not supply an entry thesis or guarantee that any setup is suitable.
Does the participation score always use actual volume?
No. The source explicitly documents a range-based fallback on symbols without volume, so that reading must be treated as an approximation.
Can I change how much each component contributes to the gate?
Yes. Weights set each factor's contribution to the composite, and factor lengths define its measurement window. Increasing a favored factor's weight can raise the score without improving the underlying market conditions.
Product overview and access scope
Market Tradability Gate is a direction-neutral chart-conditions filter built from configured price and volume or range measurements. It blends four components — trend clarity, volatility adequacy, efficiency (noise), and participation — into a single 0-100 Tradability score with a confirmed Open / Review / Restricted state, and it names the weakest link so you know exactly what is holding conditions back.
5-Year Access only. Manual activation for one TradingView username after verified payment.
Product-specific chart proof
How do confirmed trend, volatility, efficiency and participation readings describe this chart before you assess direction?
How do confirmed trend, volatility, efficiency and participation readings describe this chart before you assess direction? Market Tradability Gate turns that question into a repeatable TradingView review process.

What it organizes
Market Tradability Gate is a direction-neutral chart-conditions filter built from configured price and volume or range measurements. It blends four components — trend clarity, volatility adequacy, efficiency (noise), and participation — into a single 0-100 Tradability score with a confirmed Open / Review / Restricted state, and it names the weakest link so you know exactly what is holding conditions back.
Analytical and educational use only. No auto-trading, broker execution, financial advice or guaranteed outcome.
Complete product intelligence
Understand the workflow before you activate it.
Purpose, methodology, chart language, operating conditions, controls and limitations are presented below so you can evaluate fit before purchase.
System, Purpose & Difference What the workflow exists to solve, what it produces and why its design differs from generic signal tools.
Core Idea
How do confirmed trend, volatility, efficiency and participation readings describe this chart before you assess direction?
What This Workflow Does
Market Tradability Gate is a direction-neutral chart-conditions filter built from configured price and volume or range measurements. It blends four components — trend clarity, volatility adequacy, efficiency (noise), and participation — into a single 0-100 Tradability score with a confirmed Open / Review / Restricted state, and it names the weakest link so you know exactly what is holding conditions back.
Its confirmed gate summarizes the configured conditions; it does not measure account losses, order-book depth or executable trade economics. A price-following context band, optional confirmed-state tint and transition markers keep the model context visible.
Purpose & Design Philosophy
The workflow separates a directional setup idea from recent movement conditions. It makes the configured volatility, efficiency and participation assumptions inspectable without claiming that those factors explain your losses or that an Open gate makes a setup suitable.
Why It Is Different
Most condition tools measure one thing — a choppiness index, an ADX reading, a volatility band — and leave you to assemble the picture.
This script does NOT rely on a single metric and does NOT pretend one number captures tradability.
Instead, it combines four configured components into one weighted score, then exposes each sub-score and explicitly names the weakest link. You see not just that conditions are marginal, but why — "Efficiency 22 — choppy / noisy" or "Participation 18 — thin" — which is the difference between a vague feeling and an actionable read.
Methodology & Chart Language How context is processed and how zones, labels, colors, panels and visual states should be read.
Methodology
- Trend Clarity: Directional strength (ADX). Strong, persistent direction scores high; aimless drift scores low.
- Volatility Adequacy: ATR% is compared with its historical baseline. The configured curve favors a ratio near 1.1 and scores unusually quiet or elevated movement lower. It does not calculate spreads, fees, slippage or whether movement covers trading costs.
- Efficiency / Noise: The Kaufman Efficiency Ratio (net move ÷ total path). Clean directional travel scores high; back-and-forth chop scores low.
- Participation: Relative volume is used when a nonnegative bar has a positive volume baseline. Missing volume or an all-zero baseline uses relative range; a zero-volume bar against a positive baseline scores zero. Neither source measures spreads, exchange depth or liquidity for your order size.
- Composite & Weakest Link: A weighted blend gives the score and the lowest component is disclosed. The enabled critical floor checks all four factors, even a factor with zero composite weight. Open or Restricted transitions require consecutive qualifying completed bars; entering the review buffer alone holds the prior confirmed gate.
How to Read the Chart
- Background tint = the confirmed gate state: faint teal when Open, faint red when Restricted.
- GATE OPEN / GATE RESTRICTED markers = confirmed transitions into those gate states (kept sparse and spaced).
- GATE badge = the latest confirmed gate and score, with pending or buffer context; it is not an intrabar live-score decision.
- Panel pages = Overview separates the held gate, pending candidate, weakest factor and floor; Factors shows the four confirmed component scores, participation source and effective thresholds.
Use Overview and Factors together to distinguish the weighted score from the weakest-factor floor and the source of participation data.
Signals, States & Alerts What each visible state represents and when an alert marks a condition that deserves attention.
Signals & States
- OPEN → the gate has confirmed the open-state requirement on completed bars
- REVIEW → mixed or intermediate context requires review
- RESTRICTED → the gate has confirmed the restricted-state requirement
- PENDING / BUFFER → a candidate score zone has not changed the held confirmed gate state
- DATA WAIT / SET WEIGHTS → the data or positive-weight requirement is not yet satisfied
These are confirmed chart/model states, not entry instructions, fills, or future probabilities.
Best Conditions & When to Step Back Where the workflow is most useful, which conditions weaken interpretation and how context changes the reading.
When to Use
- Before every session or setup, as a go / no-go conditions check.
- To stay out of chop and thin tape that erode an otherwise sound strategy.
- As conditions context alongside an independent setup and risk process; an Open gate is not permission or an instruction to trade.
When Not to Use
- As an entry or direction signal — it is neither.
- On very low-liquidity symbols where the factor inputs are unstable.
- As permission to override a working plan or risk limit: a green gate is a model state, not evidence of account suitability or a setup by itself.
Controls, Interface & Practical Workflow The main inputs, visual controls and a repeatable sequence for using the workflow without losing chart clarity.
Key Inputs
- Factor lengths → ADX, ATR, efficiency, and participation windows.
- Weights → each factor’s composite contribution; zero weight does not remove that factor from an enabled critical-factor floor.
- Thresholds → candidate Open and Restricted score zones; completed-bar confirmation and buffer behavior govern the held state.
- Visuals → regime tint, transition markers, marker spacing, gate badge, theme, position, font size.
Boundaries, Limitations & Risk What the workflow does not do, where its outputs can weaken and the risk boundaries every buyer should understand.
What This Workflow Is Not
- Not a prediction engine and not a directional signal.
- Not financial advice.
- Not an automated trading system.
- Not a guarantee that an "Open" reading will produce a winning trade.
Limitations & Transparency
The composite depends on its weights and thresholds, which are adjustable — different settings will shift the score, so calibrate them to your market and style. Factor readings reflect recent behavior and will lag sudden regime changes. On symbols without volume, participation uses a range-based proxy, which is an approximation. Read the gate as a conditions estimate to inform judgement, not a precise verdict.
Risk Disclosure
Trading involves substantial risk. This script is an analytical and educational tool only. It does not provide financial advice or guaranteed outcomes. All trading decisions, and their consequences, remain entirely your own responsibility.
5-Year Access & Delivery The access term, payment-to-activation sequence and the TradingView username required for manual delivery.
5-Year Access & Delivery
- New-purchase access: At least five years of access — 1,827 days from purchase. One-time payment; no automatic renewal.
- One TradingView username: submit the exact username during checkout.
- Manual activation: invite-only access is enabled after payment confirmation.
This is an analytical and educational TradingView workflow. It does not connect to a broker, place trades, manage an account, provide financial advice, or guarantee results. Trading involves risk, and every decision remains the user's responsibility.
Before you buy
Clear access. Clear purpose. No signal-shop promises.
Market Tradability Gate is delivered as a TradingView Pine Script workflow for structured analysis and chart review. Access is activated manually for the TradingView username submitted at checkout.
- TradingView accessInvite-only access is enabled after payment confirmation.
- Analysis workflowDesigned for context, structure, risk review and visual discipline.
- Not auto-tradingNo broker connection, no account management and no guaranteed outcome.
Product FAQ
Is this a TradingView Pine Script workflow?
Yes. This product is an invite-only AGPro Series workflow for use inside TradingView.
Does it trade automatically?
No. AGProLabs workflows are analytical tools. They do not connect to brokers, place trades or guarantee outcomes.
How is access activated?
Access is activated manually for the TradingView username submitted during checkout after payment confirmation.
Does access include TradingView or paid market data?
No. This purchase provides invite-only access to the selected AGProLabs workflow. It does not include a TradingView subscription or paid exchange data. Check your TradingView plan, available data, chart resources and alert capabilities for your intended workflow before ordering; contact support if unsure.
Related workflows
-
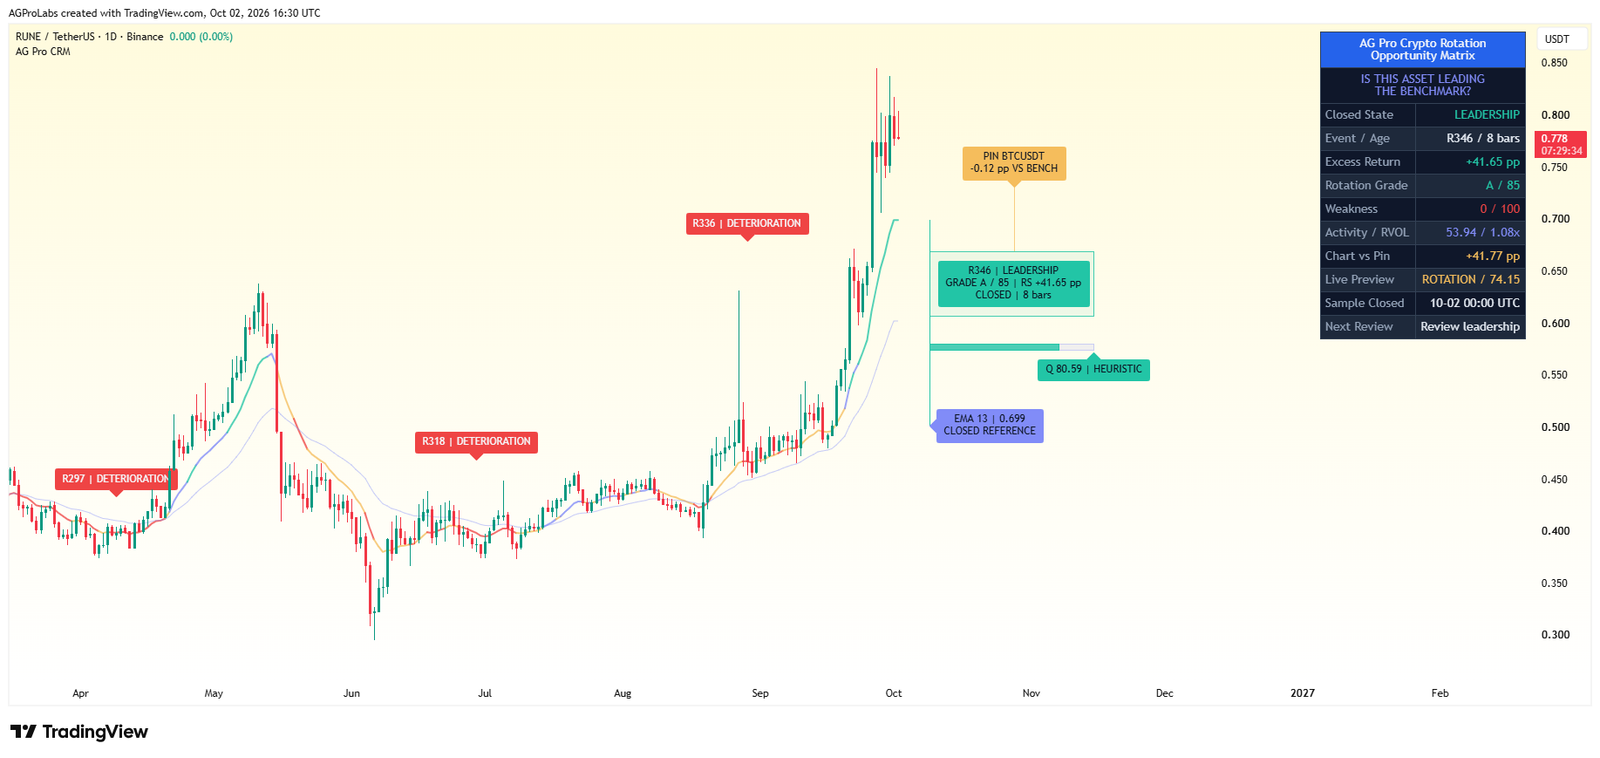
Crypto Rotation Opportunity Matrix [AGPro Series]
Review the active crypto chart and one pinned alternative against the same benchmark.
AccessSingle workflow 5-Year Access$149.00 View workflow One 5-Year Access option. View details on the product page. -

Adaptive Market Playbook [AGPro Series]
Match your chart review to the confirmed market mode and its reference zone.
AccessSingle workflow 5-Year Access$149.00 View workflow One 5-Year Access option. View details on the product page. -

CME Gap Magnet [AGPro Series]
Check actual CME Bitcoin or Ether futures gaps beside open and filled zones.
AccessSingle workflow 5-Year Access$149.00 View workflow One 5-Year Access option. View details on the product page. -
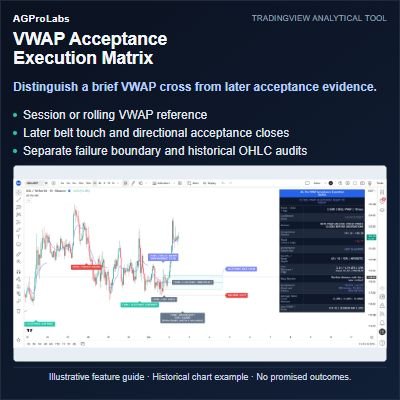
VWAP Acceptance Execution Matrix [AGPro Series]
Separate a brief VWAP cross from later acceptance confirmation and failure pressure.
AccessSingle workflow 5-Year Access$149.00 View workflow One 5-Year Access option. View details on the product page.
Compare other premium products (40)
Open a product to review its methodology, interface and access details.
Confirmation & Playbook
- Adaptive Market Playbook [AGPro Series]
- CME Gap Magnet [AGPro Series]
- Confluence Alert Engine [AGPro Series]
- Crypto Rotation Opportunity Matrix [AGPro Series]
- Crypto Setup Planner [AGPro Series]
- Divergence Reversal Decision Matrix [AGPro Series]
- Dynamic Channels Elite [AGPro Series]
- Edge Confidence Gauge [AGPro Series]
- Edge Consistency Gauge [AGPro Series]
- Expected Move Cone [AGPro Series]
- Market Confirmation Engine [AGPro Series]
- Rejection Block Execution Planner [AGPro Series]
- Seasonal Edge Clock [AGPro Series]
- Support Resistance Continuation Matrix [AGPro Series]
- Trade Edge Profiler [AGPro Series]
- VWAP Acceptance Execution Matrix [AGPro Series]
Defense & Management
Liquidity & Reclaim
Platform Access
Risk & Execution
- Position Scaling Engine [AGPro Series]
- R-Expectancy Surface [AGPro Series]
- Risk of Ruin Engine [AGPro Series]
- Risk Reward Execution Matrix [AGPro Series]
- Target Ladder Confluence Planner [AGPro Series]
- Trade Excursion Engine [AGPro Series]
- Trade Management Planner Elite [AGPro Series]
- Trade Outcome Simulator [AGPro Series]
SMC & Structure
- Auto Fib Structure Planner [AGPro Series]
- Breaker Block Transition Planner [AGPro Series]
- Harmonic Completion Engine [AGPro Series]
- Institutional Reaction Planner Elite [AGPro Series]
- Structure Failure Recovery Matrix [AGPro Series]
- Trade Conviction Engine [AGPro Series]
- Trendline Retest Execution Matrix [AGPro Series]