

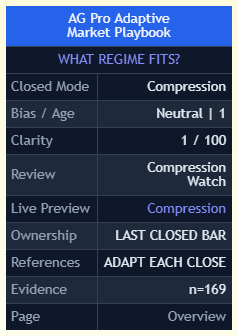
Market regime context
TradingView Pine Script Workflow
Adaptive Market Playbook [AGPro Series]
5-Year Access, one-time payment. Manual TradingView activation. TradingView and data fees are separate.
Get Access — $149$149.00
Match the chart review to the market mode that is actually developing.
Start with the environment before reviewing a tactic. Four modes combine EMA structure, volatility and range position, with a clarity score, mode-aware zone and separate completed-regime evidence.
- One focused workflow
- 5-Year Access · one-time
- Manual TradingView activation
Already paid through Whop? Get TradingView access help
View actual chart & all settings First gallery image: full historical TradingView chart. Second image: historical panel detail. Open the full chart for context; no live signal or performance record.
Manual TradingView activation
Submit the exact TradingView username at checkout. Manual review begins after verified payment; access confirmation follows when activation is complete.
One-time payment. No subscription. Available payment methods are shown before order placement.
Need help before purchase? Ask AGProLabs →
Inside Adaptive Market Playbook
Match the chart review to the market mode that is actually developing.
Adaptive Market Playbook combines trend, volatility, and range context into four named modes: Trending, Ranging, Expansion, and Compression. It pairs the active mode with a directional bias, clarity score, contextual plan, and mode-aware zone and levels. The goal is to make a changing environment visible before the same interpretation is applied everywhere. The dashboard's plan changes with the classified condition, but remains an analytical guide rather than an instruction to enter or exit.
Choose with a clear purpose
What this workflow helps you inspect.
For traders who want to classify current market conditions before selecting which independent setup or chart question to review.
- Distinguish directional structure from volatility and position within the working range.
- Connect the confirmed mode with the relevant zone and key levels.
- Review mode-change history without confusing completed durations with the current regime.
Read the detailed workflow fit
- For users who want a consistent first step before studying a specific setup: establish the current type of environment. The playbook can organize the difference between trend-oriented pullback review, range-extreme review, expansion context, and preparation during compression. It is useful when the problem is applying one preferred approach to every chart state.
Inspect interface detail Trend and volatility measurements
A directional-looking chart can be quiet, expanding, or too weakly defined to support the same interpretation.
Working range and position
Trend and volatility alone do not locate price within its recent working area.
Four-mode classification and clarity
A single fixed approach can obscure changes in the conditions it depends on.
See what each layer contributes.
Open a module to explore its purpose, practical interpretation and boundaries. Examples describe a review process; they are not promises of a trading result.
01Trend and volatility measurementsA directional-looking chart can be quiet, expanding, or too weakly defined to support the same interpretation.
A multi-EMA model with slope produces trend direction and a 0–100 strength reading. ATR compared with its own baseline supplies contraction, normal, or expansion context. Reading these together separates direction from the state of movement, instead of assuming that any sloping average describes the complete environment.
A practical reading
A directional trend reading and an expanding volatility reading are different observations and should both remain visible in the review.
Keep in view: Recent measurements can lag abrupt changes, and the scores do not establish a favorable trading opportunity.
02Working range and positionTrend and volatility alone do not locate price within its recent working area.
A rolling lookback frames the working high, low, and midpoint, together with price's position in that range. This supplies a spatial reference for the playbook. It helps the analyst distinguish being near a range extreme from being near the middle, without needing to infer those positions from the mode label alone.
A practical reading
When the mode is Ranging, inspect the working extremes and midpoint before interpreting the associated contextual plan.
Keep in view: The rolling frame changes as data changes and does not guarantee that the range boundaries will contain price.
03Four-mode classification and clarityA single fixed approach can obscure changes in the conditions it depends on.
After valid inputs and warm-up, priority is Compression, then Trending, then Expansion, otherwise Ranging. The heuristic clarity describes rule definition on closed context, not a success probability. The contextual plan changes with that classification. A separate live preview can change intrabar and must not be confused with confirmed mode history.
A practical reading
A transition from Compression to Expansion changes the type of review context, rather than merely changing a directional arrow.
Keep in view: Clarity measures definition under the rules, not certainty about the next move or probability that a plan succeeds.
04Adaptive zone, levels, and dashboardA regime label can remain abstract unless its implications are connected to the chart.
The context zone, key levels, bias logic, and displayed plan adapt to the active mode. The projected zone includes a centered plan label, while history tags mark mode changes. Overview separates Closed Mode, bias/age, clarity and a live preview; Metrics shows closed trend, ATR ratio, range position and reference levels. Evidence shows completed regime-run stability at the selected duration threshold, a 90% Wilson lower estimate, mean duration and excluded partial/open runs. It describes regime durations, not trade outcomes.
A practical reading
Use a history tag to locate a prior mode transition, then inspect how the active zone and plan differed from the current one.
Keep in view: History labels are descriptive context and are not a backtested record of executable entries or realized returns.
Understand the controls before changing them.
Explore the main controls and control groups below. Read the current TradingView Inputs and tooltips for the available values; choose a consistent configuration before reviewing its results.
Trend Module
EMA lengths define the trend-strength and direction measurements.
When to adjust
When deliberately studying a different trend horizon.
Watch for
Different lengths can change both mode timing and directional context.
Volatility Module
ATR length and its baseline define contraction and expansion detection.
When to adjust
When the intended volatility reference changes.
Watch for
The baseline is relative to recent behavior, not an absolute judgment of market safety.
Range Module
The lookback frames the working high, low, and midpoint.
When to adjust
When comparing a more local or broader working range.
Watch for
Changing the frame changes price's reported range position.
Mode Thresholds
Trend-strength, compression and expansion cutoffs govern classification; Mode Stability Threshold controls the completed-run duration counted as stable in Evidence.
When to adjust
To inspect the sensitivity of mode assignments.
Watch for
A threshold change is not evidence that the newly favored plan will perform better.
Labels and Zone
Control history-label spacing, label offset, and projection length.
When to adjust
When mode tags or the projected zone obscure price action.
Watch for
Longer projection is a drawing choice, not a forecast horizon guarantee.
Panel
Controls Overview, Metrics or Evidence page, plus theme, location, font size and show/hide.
When to adjust
To keep the classification and supporting context legible.
Watch for
Preserve access to the inputs behind the mode rather than relying only on color.
Complete settings reference
Open complete settings reference
Every setting, explained.
Explore each input, its source default, available choices and practical effect before changing your configuration.
The reference shows defaults in the verified source. A preset or saved chart can retain different input values. Chart captures illustrate the interface and are not a live signal or a performance record.
From first look to a documented observation.
- Start with Closed Mode and clarity, keeping Live Preview separate. Before using Evidence, check completed-run counts, the duration threshold and partial/open-run exclusions.
- Check trend strength, volatility state, and range position to understand the basis of the classification.
- Inspect the mode-aware zone and key levels alongside the contextual plan, then examine actual price behavior.
- Reassess after mode changes and keep any setup rules, execution decisions, and risk limits separate from the dashboard.
Answers specific to this workflow.
Does the playbook tell me exactly when to enter?
No. It classifies conditions and presents matching review context. The source explicitly states that its modes are not directives to enter or exit.
Can a mode change after new bars form?
Yes. Classifications update with the measurements, and transitions introduce natural lag. Different timeframes and instruments can show different modes.
Can I inspect completed regime durations as well as the current mode?
Yes. Overview, Metrics and Evidence separate current context from completed regime-duration observations. Mode-change tags provide chart history; they are not a backtest of executable entries or returns.
Product overview and access scope
Adaptive Market Playbook is a market-regime and decision dashboard. It classifies the last closed context into Trending, Ranging, Expansion or Compression, with a separate live preview and descriptive completed-run Evidence page.
5-Year Access only. Manual activation for one TradingView username after verified payment.
Product-specific chart proof
Are you trading the right way for the market you are actually in? This script reads the current market mode and hands you the matching game plan.
Are you trading the right way for the market you are actually in? This script reads the current market mode and hands you the matching game plan. Adaptive Market Playbook turns that question into a repeatable TradingView review process.
What it organizes
Adaptive Market Playbook is a market-regime and decision dashboard. It classifies confirmed closed-bar context into one of four market modes - Trending, Ranging, Expansion or Compression - and adapts everything it shows to that mode.
Analytical and educational use only. No auto-trading, broker execution, financial advice or guaranteed outcome.
Complete product intelligence
Understand the workflow before you activate it.
Purpose, methodology, chart language, operating conditions, controls and limitations are presented below so you can evaluate fit before purchase.
System, Purpose & Difference What the workflow exists to solve, what it produces and why its design differs from generic signal tools.
Core Idea
Are you trading the right way for the market you are actually in? This script reads the current market mode and hands you the matching game plan.
What This Workflow Does
Adaptive Market Playbook is a market-regime and decision dashboard. It classifies confirmed closed-bar context into one of four market modes - Trending, Ranging, Expansion or Compression - and adapts everything it shows to that mode.
For each confirmed mode it presents analytical review context, directional bias, a heuristic 0–100 clarity score and mode-aware reference levels. Overview separates the last closed mode from a live preview; Metrics exposes closed references. Evidence adds completed regime-run stability, a 90% Wilson lower estimate and mean duration—not a trade backtest or a forecast that the current mode will persist.
Purpose & Design Philosophy
Different chart regimes call for different questions. The playbook makes those questions visible while keeping regime classification, descriptive duration evidence and independent execution decisions separate.
Why It Is Different
Most tools apply one fixed logic to every market - the same signal in a trend, a range, or a dead zone - and leave it to you to notice when that logic no longer fits.
This script does NOT assume the market is always trending, and it does NOT show the same guidance in every condition.
Methodology & Chart Language How context is processed and how zones, labels, colors, panels and visual states should be read.
Methodology
- Trend Measurement: A multi-EMA model with slope produces a 0-100 trend strength reading and a trend direction.
- Volatility State: ATR is compared to its own baseline to detect contraction, normal, or expansion conditions.
- Range Framing: A rolling lookback defines the working high, low and mid, and where price sits inside that range.
- Mode Classification: After valid inputs and data warm-up, the rule order is Compression, then Trending, then Expansion, otherwise Ranging. The committed mode and heuristic clarity belong to the last closed bar; a changing live preview does not rewrite confirmed history.
- Adaptive Output: Each closed mode maps to its own review context, bias and reference zone/levels. Expansion uses five-bar directional context and a prior-range reference; it does not confirm a breakout.
- Mode Stability Evidence: Completed runs are grouped by mode. The stability share counts durations reaching the chosen bar threshold, alongside a 90% Wilson lower estimate and mean duration. The open run and partial/data-gap runs are excluded; fewer than 20 completed runs is explicitly small-sample context.
How to Read the Chart
- Panel: Overview shows Closed Mode, bias/age, clarity, review context and a separate Live Preview; Metrics shows closed trend, ATR ratio, range position and reference levels; Evidence shows completed-run stability, Wilson lower estimate, mean duration and exclusions.
- Context zone: a right-projected analytical shelf with a centered closed mode, bias, clarity and age label. Its reference levels adapt at each close; projection length is a drawing choice, not a forecast horizon.
- History labels: compact mode tags marking where the market mode changed.
- Colors: green and pink indicate directional trending, amber indicates ranging, and indigo is used for expansion and the current compression presentation.
Signals, States & Alerts What each visible state represents and when an alert marks a condition that deserves attention.
Signals & States
- Trending -> directional conditions dominate; plan favors trading pullbacks with the trend.
- Ranging -> price oscillates in a band; plan favors fading the extremes toward the mid.
- Expansion -> volatility is opening up; plan favors reviewing expansion context; it does not confirm a breakout.
- Compression -> volatility is contracting; plan favors standing by and preparing.
These describe the current market condition. They are not directives to enter or exit.
Best Conditions & When to Step Back Where the workflow is most useful, which conditions weaken interpretation and how context changes the reading.
When to Use
- Across changing market conditions where a single fixed approach struggles.
- As a top-of-chart context check before choosing a tactic.
- On liquid instruments where trend, range and volatility are meaningful.
- To confirm whether the current market suits trend, mean-reversion or breakout tactics.
When Not to Use
- On illiquid instruments with erratic, unreliable structure.
- During news-driven shocks where mode can flip rapidly.
- As a standalone reason to enter or exit a trade.
- When you would ignore the mode and trade one fixed way regardless.
Controls, Interface & Practical Workflow The main inputs, visual controls and a repeatable sequence for using the workflow without losing chart clarity.
Key Inputs
- Trend Module -> EMA lengths that define trend strength and direction.
- Volatility Module -> ATR length and baseline that set contraction and expansion detection.
- Range Module -> lookback that frames the working high, low and mid.
- Mode Thresholds -> trend-strength, compression and expansion cutoffs govern classification; Mode Stability Threshold sets the completed-run duration used by Evidence.
- Labels & Zone -> history label spacing, label offset, and zone projection length.
- Panel -> theme, location, font size, and show / hide.
Boundaries, Limitations & Risk What the workflow does not do, where its outputs can weaken and the risk boundaries every buyer should understand.
What This Workflow Is Not
- It is NOT a prediction engine.
- It is NOT financial advice.
- It is NOT an automated trading system.
- It does NOT generate guaranteed signals or outcomes.
Limitations & Transparency
Confirmed ownership changes on completed candles; the separate live preview may change intrabar. Warm-up or invalid inputs can leave the model unavailable. Completed regime durations and their Wilson estimate are descriptive, with exclusions and small-sample limits; they do not establish future persistence, independent samples or trading profitability. Behaviour varies across timeframes and instruments.
Risk Disclosure
Trading involves substantial risk. This script is provided for educational and analytical purposes only and does not constitute financial advice. All trading decisions and their outcomes are the sole responsibility of the user. Past behavior of any indicator does not guarantee future results.
5-Year Access & Delivery The access term, payment-to-activation sequence and the TradingView username required for manual delivery.
5-Year Access & Delivery
- New-purchase access: At least five years of access — 1,827 days from purchase. One-time payment; no automatic renewal.
- One TradingView username: submit the exact username during checkout.
- Manual activation: invite-only access is enabled after payment confirmation.
This is an analytical and educational TradingView workflow. It does not connect to a broker, place trades, manage an account, provide financial advice, or guarantee results. Trading involves risk, and every decision remains the user's responsibility.
Before you buy
Clear access. Clear purpose. No signal-shop promises.
Adaptive Market Playbook is delivered as a TradingView Pine Script workflow for structured analysis and chart review. Access is activated manually for the TradingView username submitted at checkout.
- TradingView accessInvite-only access is enabled after payment confirmation.
- Analysis workflowDesigned for context, structure, risk review and visual discipline.
- Not auto-tradingNo broker connection, no account management and no guaranteed outcome.
Product FAQ
Is this a TradingView Pine Script workflow?
Yes. This product is an invite-only AGPro Series workflow for use inside TradingView.
Does it trade automatically?
No. AGProLabs workflows are analytical tools. They do not connect to brokers, place trades or guarantee outcomes.
How is access activated?
Access is activated manually for the TradingView username submitted during checkout after payment confirmation.
Does access include TradingView or paid market data?
No. This purchase provides invite-only access to the selected AGProLabs workflow. It does not include a TradingView subscription or paid exchange data. Check your TradingView plan, available data, chart resources and alert capabilities for your intended workflow before ordering; contact support if unsure.
Related workflows
-
Support Resistance Continuation Matrix [AGPro Series]
Check continuation after a confirmed level test against its pocket and failure boundary.
AccessSingle workflow 5-Year Access$149.00 View workflow One 5-Year Access option. View details on the product page. -

Market Tradability Gate [AGPro Series]
Check the weakest market condition behind the gate before reviewing a directional setup.
AccessSingle workflow 5-Year Access$149.00 View workflow One 5-Year Access option. View details on the product page. -

CME Gap Magnet [AGPro Series]
Check actual CME Bitcoin or Ether futures gaps beside open and filled zones.
AccessSingle workflow 5-Year Access$149.00 View workflow One 5-Year Access option. View details on the product page. -
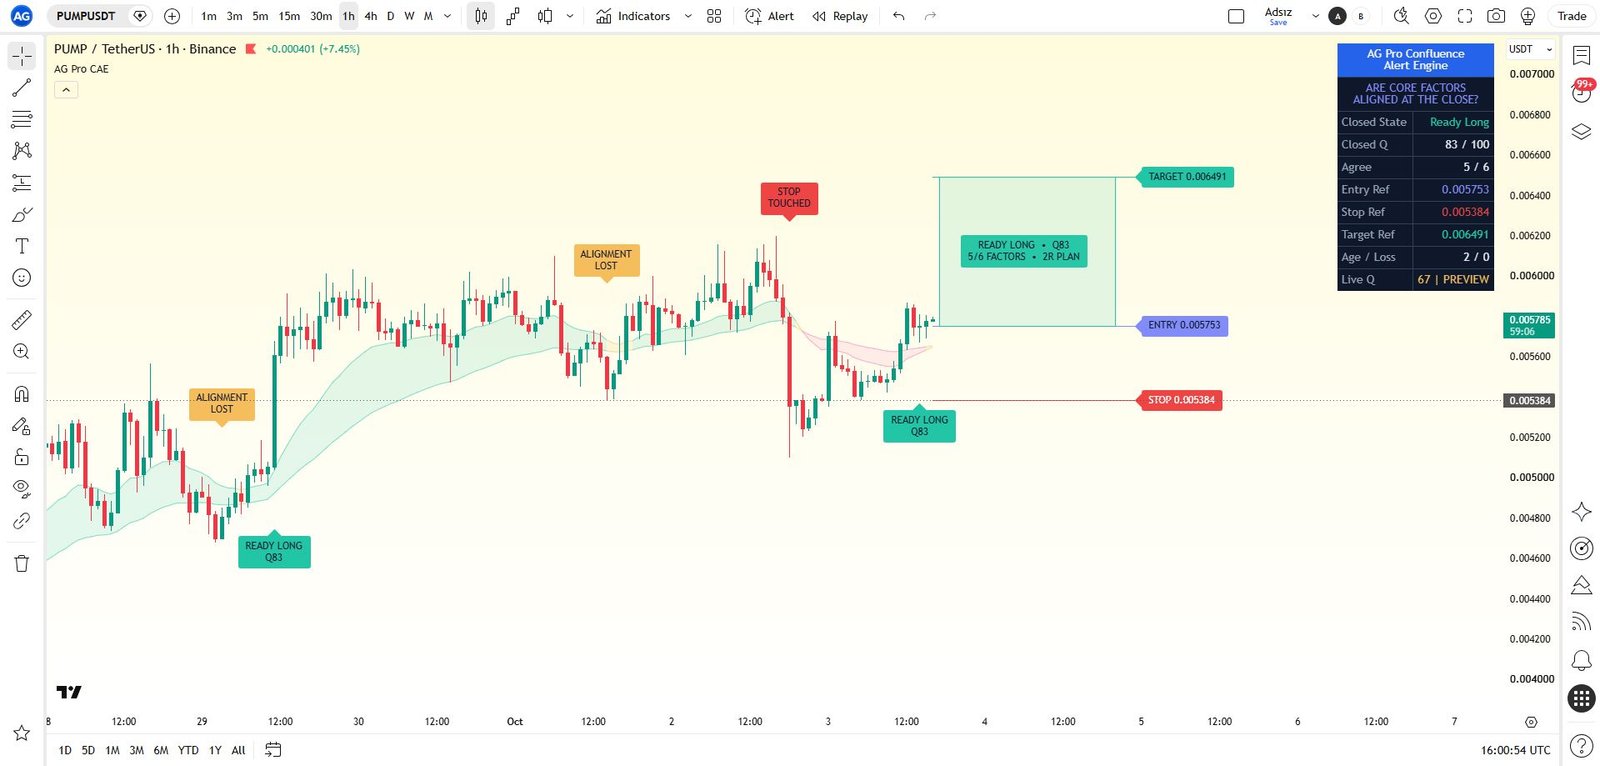
Confluence Alert Engine [AGPro Series]
See which of six factors agree before reviewing a Ready setup on one chart.
AccessSingle workflow 5-Year Access$149.00 View workflow One 5-Year Access option. View details on the product page.
Compare other premium products (40)
Open a product to review its methodology, interface and access details.
Confirmation & Playbook
- CME Gap Magnet [AGPro Series]
- Confluence Alert Engine [AGPro Series]
- Crypto Rotation Opportunity Matrix [AGPro Series]
- Crypto Setup Planner [AGPro Series]
- Divergence Reversal Decision Matrix [AGPro Series]
- Dynamic Channels Elite [AGPro Series]
- Edge Confidence Gauge [AGPro Series]
- Edge Consistency Gauge [AGPro Series]
- Expected Move Cone [AGPro Series]
- Market Confirmation Engine [AGPro Series]
- Market Tradability Gate [AGPro Series]
- Rejection Block Execution Planner [AGPro Series]
- Seasonal Edge Clock [AGPro Series]
- Support Resistance Continuation Matrix [AGPro Series]
- Trade Edge Profiler [AGPro Series]
- VWAP Acceptance Execution Matrix [AGPro Series]
Defense & Management
Liquidity & Reclaim
Platform Access
Risk & Execution
- Position Scaling Engine [AGPro Series]
- R-Expectancy Surface [AGPro Series]
- Risk of Ruin Engine [AGPro Series]
- Risk Reward Execution Matrix [AGPro Series]
- Target Ladder Confluence Planner [AGPro Series]
- Trade Excursion Engine [AGPro Series]
- Trade Management Planner Elite [AGPro Series]
- Trade Outcome Simulator [AGPro Series]
SMC & Structure
- Auto Fib Structure Planner [AGPro Series]
- Breaker Block Transition Planner [AGPro Series]
- Harmonic Completion Engine [AGPro Series]
- Institutional Reaction Planner Elite [AGPro Series]
- Structure Failure Recovery Matrix [AGPro Series]
- Trade Conviction Engine [AGPro Series]
- Trendline Retest Execution Matrix [AGPro Series]