

Volume climax review
TradingView Pine Script Workflow
Volume Climax Trap Matrix [AGPro Series]
5-Year Access, one-time payment. Manual TradingView activation. TradingView and data fees are separate.
Get Access — $149$149.00
Distinguish a volume spike from a structured climax-and-trap review.
Give an unusual volume event a defined follow-up process. Relative volume and range qualify the climax; mapped structure, trap context and invalidation then frame the later review.
- One focused workflow
- 5-Year Access · one-time
- Manual TradingView activation
Already paid through Whop? Get TradingView access help
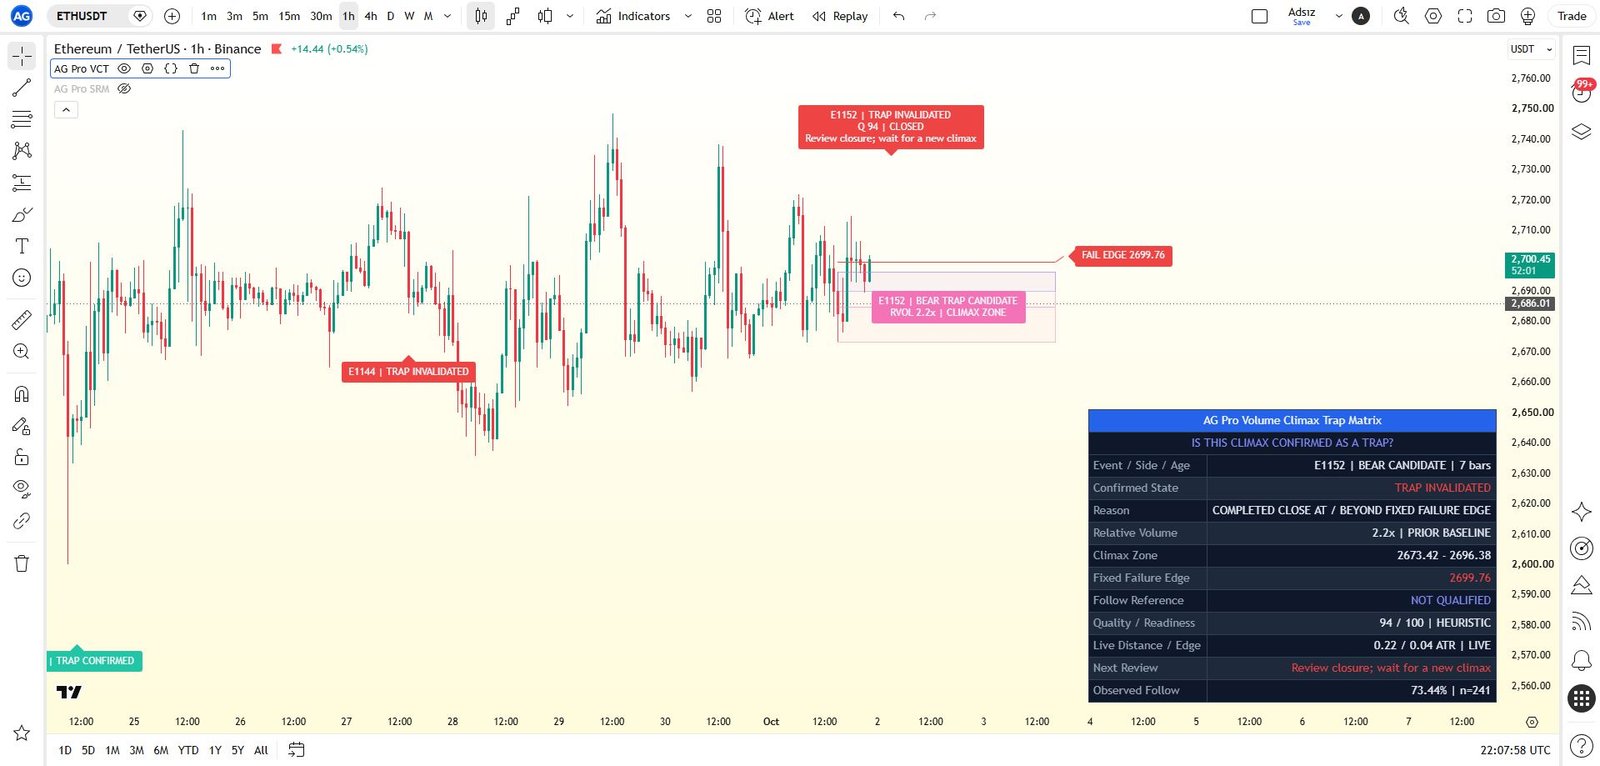
View actual chart & all settings First gallery image: historical TradingView interface. Second image: illustrative cover. Open the gallery to inspect details.
Manual TradingView activation
Submit the exact TradingView username at checkout. Manual review begins after verified payment; access confirmation follows when activation is complete.
One-time payment. No subscription. Available payment methods are shown before order placement.
Need help before purchase? Ask AGProLabs →
Inside Volume Climax Trap Matrix
Distinguish a volume spike from a structured climax-and-trap review.
Volume Climax Trap Matrix connects elevated participation with the price behavior around it. Relative volume and range expansion qualify a climax; wick pressure, close recovery, body efficiency, and directional progress help organize trap pressure and exhaustion. The active range, trap band, invalidation reference, readiness, and decision panel keep the stages visible. This gives a volume event a context to inspect instead of assuming that exceptional activity automatically means either continuation or reversal.
Choose with a clear purpose
What this workflow helps you inspect.
For traders studying unusual volume and range events who want to inspect subsequent trap and retest behavior in sequence.
- Separate the initial climax from the later evidence needed for trap confirmation.
- Compare wick pressure and close recovery with directional progress.
- Keep exhaustion and invalidation visible instead of relying on a volume spike alone.
Read the detailed workflow fit
- For chart users examining high-volume candles and what follows them. It is especially relevant when a large candle attracts attention but its close, wicks, and subsequent progress tell a less straightforward story. The workflow is a staged volume-flow review, and its usefulness depends on the quality and meaning of the available chart volume.
 Inspect interface detail
Climax qualification against a baseline
A visually large volume bar is not a consistent definition across symbols and sessions.
Trap pressure around the climax candle
Strong activity can accompany failed continuation rather than clean directional progress.
Exhaustion and readiness
High participation does not necessarily produce efficient directional movement.
See what each layer contributes.
Open a module to explore its purpose, practical interpretation and boundaries. Examples describe a review process; they are not promises of a trading result.
01Climax qualification against a baselineA visually large volume bar is not a consistent definition across symbols and sessions.
The script compares relative volume, candle range expansion, wick pressure, body efficiency, and close location with a configurable baseline. A climax event qualifies when relative volume and range expansion meet the selected sensitivity profile. This separates ordinary activity from the active event the workflow is currently studying.
A practical reading
Inspect both relative volume and range expansion before labeling an attention-grabbing candle as a qualified climax.
Keep in view: Different exchanges and sessions can supply different volume behavior; the same visual height does not imply equivalent participation quality.
02Trap pressure around the climax candleStrong activity can accompany failed continuation rather than clean directional progress.
Wick pressure and close recovery contribute to bullish or bearish trap review around the qualified candle. The trap band identifies the area where that behavior matters, while the climax zone retains the broader high-volume structure. Separating the two makes it easier to distinguish the original event from the narrower interaction being reviewed afterward.
A practical reading
A substantial wick and recovery in the close can create a different review context from a similarly high-volume candle closing near its extreme.
Keep in view: Trap terminology is a rule-based price interpretation, not proof of deliberate trapping or participant intent.
03Exhaustion and readinessHigh participation does not necessarily produce efficient directional movement.
Exhaustion remains context rather than self-confirmation by the climax candle. The current workflow separates CLIMAX DETECTED or UNCLASSIFIED, later CONFIRMATION BUILDING, TRAP CONFIRMED, and RETEST CONFIRMED. Reaction loss, recovery, and terminal outcomes are tracked separately.
A practical reading
High activity with reduced progress can raise exhaustion review even when the initial candle looked strongly directional.
Keep in view: Exhaustion does not predict the exact turning point, and READY is not an entry or exit command.
04Invalidation and current contextA compelling climax story can persist after price has moved against the original review structure.
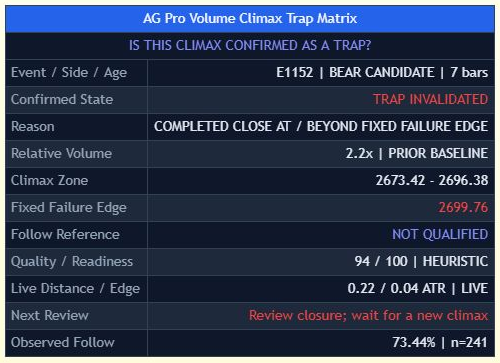
The invalidation reference lies beyond the climax structure and tracks pressure against the active context. The current badge summarizes state, readiness, and trap pressure; the panel adds side, relative volume, exhaustion, invalidation, and next action. Historical attention labels retain selected events without replacing the need to inspect the current boundary.
A practical reading
INVALIDATION REVIEW can become the relevant state when pressure undermines the earlier trap interpretation.
Keep in view: The reference is an analytical boundary, not a guaranteed limit on price movement or loss.
Understand the controls before changing them.
Explore the main controls and control groups below. Read the current TradingView Inputs and tooltips for the available values; choose a consistent configuration before reviewing its results.
Matrix Mode
Chooses both sides, bullish trap only, or bearish trap only.
When to adjust
To focus on a defined climax scenario.
Watch for
Direction filtering does not establish that a reversal will occur.
Baseline Lookback
Defines the measurement window for volume, range, and exhaustion context.
When to adjust
When comparing the event with a different recent baseline.
Watch for
Changing the reference window changes the meaning of relative readings.
Volume Sensitivity
Controls the strictness of climax qualification.
When to adjust
When calibrating which activity events deserve review.
Watch for
A more exceptional volume event is not automatically a better trade.
Trap Sensitivity
Controls the required alignment of wick pressure and close recovery.
When to adjust
To inspect different levels of trap-review selectivity.
Watch for
The result remains an interpretation of chart behavior.
Exhaustion Sensitivity
Controls how quickly exhaustion responds to inefficient progress.
When to adjust
When comparing responsiveness around high-activity events.
Watch for
Fast response can change more frequently in noisy conditions.
Invalidation Strictness
Controls how quickly pressure against the active context increases.
When to adjust
To examine the warning response to weakening structure.
Watch for
A delayed warning does not reduce market risk.
Visual Preset
Controls chart annotation density.
When to adjust
When historical attention labels obscure the current event.
Watch for
Label quantity does not measure event quality.
Panel Theme, Location, and Font Size
Control dashboard presentation and readability.
When to adjust
To fit the chart layout without hiding current price behavior.
Watch for
Keep the invalidation and state information legible.
Complete settings reference
Open complete settings reference
Every setting, explained.
Explore each input, its source default, available choices and practical effect before changing your configuration.
The reference shows defaults in the verified source. A preset or saved chart can retain different input values. Chart captures illustrate the interface and are not a live signal or a performance record.
Get 5-Year Access $149.00
One-time payment · Manual TradingView activation
From first look to a documented observation.
- Check chart volume quality, the baseline, and which side the matrix is allowed to evaluate.
- Identify the qualified climax range and distinguish it from the trap band.
- Read trap pressure, exhaustion, and readiness together with the candle's close and subsequent progress.
- Inspect invalidation pressure and broader volatility before attaching significance to a stronger workflow state.
Answers specific to this workflow.
Does high volume mean price is about to reverse?
No. The workflow separates qualification, trap pressure, exhaustion, and invalidation. A spike alone does not determine the next direction.
Will different exchanges show the same climax?
Not necessarily. Volume, sessions, symbols, and timeframes differ. The source explicitly warns that those differences affect states and labels.
Can I limit the review to bullish or bearish trap context?
Yes. Matrix Mode offers both sides, bullish trap only or bearish trap only. Baseline and sensitivity settings still determine which volume events and later conditions qualify.
Product overview and access scope
Volume Climax Trap Matrix is a staged volume-flow analysis workflow designed to separate raw volume spikes from structured climax behavior.
5-Year Access only. Manual activation for one TradingView username after verified payment.
Product-specific chart proof
When volume reaches a climax, is the market showing trap pressure, exhaustion, invalidation risk, or a staged reversal-review context?
When volume reaches a climax, is the market showing trap pressure, exhaustion, invalidation risk, or a staged reversal-review context? Volume Climax Trap Matrix turns that question into a repeatable TradingView review process.

What it organizes
Volume Climax Trap Matrix is a staged volume-flow analysis workflow designed to separate raw volume spikes from structured climax behavior.
Analytical and educational use only. No auto-trading, broker execution, financial advice or guaranteed outcome.
Complete product intelligence
Understand the workflow before you activate it.
Purpose, methodology, chart language, operating conditions, controls and limitations are presented below so you can evaluate fit before purchase.
System, Purpose & Difference What the workflow exists to solve, what it produces and why its design differs from generic signal tools.
Core Idea
When volume reaches a climax, is the market showing trap pressure, exhaustion, invalidation risk, or a staged reversal-review context?
What This Workflow Does
Volume Climax Trap Matrix is a staged volume-flow analysis workflow designed to separate raw volume spikes from structured climax behavior.
The script maps the active climax range, trap review band, invalidation reference, exhaustion context, readiness score, historical attention labels, and a compact decision-support panel directly on the chart.
It does not attempt to predict direction, automate execution, or provide guaranteed outcomes. It is designed as an analytical visualization layer for reviewing volume climax, trap pressure, exhaustion, and post-climax behavior.
Purpose & Design Philosophy
Volume spikes often look important, but not every spike carries the same meaning.
This script was built to organize the volume climax review process into a clearer workflow:
- Is the active climax bullish or bearish?
- Is wick pressure creating a trap-review condition?
- Is exhaustion rising while progress becomes less efficient?
- Is the active climax context still valid?
- Is the current state strong enough to review?
Why It Is Different
Most volume tools focus on detecting high volume bars or highlighting simple spike events.
This script does NOT treat every spike as a complete signal.
Instead, it evaluates the staged context around a climax event by combining relative volume, range expansion, wick pressure, close location, exhaustion, invalidation pressure, and readiness scoring into one structured workflow.
The result is not just a volume climax marker. It is a trap-and-exhaustion review matrix for understanding what the market is doing after a major participation event.
Methodology & Chart Language How context is processed and how zones, labels, colors, panels and visual states should be read.
Methodology
- Context Detection
The script measures relative volume, candle range expansion, wick pressure, body efficiency, and close location against a configurable baseline.
- Climax Qualification
A climax event is qualified when relative volume and range expansion meet the selected sensitivity profile.
- Trap Pressure Evaluation
The script reviews whether wick pressure and close recovery create bullish or bearish trap pressure around the climax candle.
- Exhaustion Evaluation
The exhaustion score increases when participation is elevated while directional progress becomes less efficient.
- Invalidation Review
The script maps an invalidation reference beyond the climax structure and tracks pressure against the active context.
- Visual Output
The chart displays the climax zone, trap band, invalidation reference, current review badge, historical attention labels, and workflow panel.
How to Read the Chart
Climax Zone shows the active high-volume structure being reviewed.
Trap Band highlights the area where wick pressure and failed continuation may matter.
Invalidation Reference marks the boundary used to review whether the active climax context is losing validity.
Current Review badge summarizes the active state, readiness score, and trap pressure.
Historical labels mark important prior states such as trap pressure, exhaustion review, trap matrix ready, or invalidation review.
Panel summarizes climax side, relative volume, trap pressure, exhaustion, readiness, invalidation, state, and next action.
Signals, States & Alerts What each visible state represents and when an alert marks a condition that deserves attention.
Signals & States
- CLIMAX DETECTED / CLIMAX UNCLASSIFIED → a qualified activity event exists, with or without a directional trap side
- CONFIRMATION BUILDING → later-candle evidence is developing; the climax candle cannot confirm itself
- TRAP CONFIRMED / RETEST CONFIRMED → the later trap or retest requirement is satisfied
- REACTION LOST / REACTION RECOVERY → the previously qualified reaction is lost or recovered under the lifecycle rules
- TRAP INVALIDATED / EVENT EXPIRED / OHLC PATH UNCERTAIN → the owner has closed or its same-bar path is uncertain
These are confirmed chart/model states, not entry instructions, fills, or future probabilities.
Best Conditions & When to Step Back Where the workflow is most useful, which conditions weaken interpretation and how context changes the reading.
When to Use
This script is most useful when reviewing:
- High-volume reaction areas
- Potential trap behavior after fast expansion
- Exhaustion after aggressive movement
- Reversal-review zones
- Major participation events
- Post-climax structure
When Not to Use
Use extra caution in:
- Extremely low-liquidity markets
- Very noisy lower timeframes
- Abnormal gap conditions
- News-driven disorder
- Markets with unreliable volume data
Weak data quality can reduce the usefulness of any volume-based workflow.
Controls, Interface & Practical Workflow The main inputs, visual controls and a repeatable sequence for using the workflow without losing chart clarity.
Key Inputs
- Matrix Mode → controls whether both sides, bullish trap only, or bearish trap only are evaluated
- Baseline Lookback → controls the measurement window for volume, range, and exhaustion context
- Volume Sensitivity → controls how strict climax qualification should be
- Trap Sensitivity → controls how strongly wick pressure and close recovery must align
- Exhaustion Sensitivity → controls how quickly exhaustion reacts to inefficient progress
- Invalidation Strictness → controls how quickly invalidation pressure increases
- Visual Preset → controls chart annotation density
- Panel Theme / Location / Font Size → controls dashboard presentation
Boundaries, Limitations & Risk What the workflow does not do, where its outputs can weaken and the risk boundaries every buyer should understand.
What This Workflow Is Not
This script is not a prediction engine.
It is not an auto-trading system.
It is not a financial advice tool.
It does not guarantee reversals.
It does not guarantee continuation.
It does not replace independent market analysis.
Limitations & Transparency
Volume behavior can vary across exchanges, symbols, sessions, and timeframes.
Lower timeframes may produce more frequent state changes.
High volatility can expand zones and increase review frequency.
The script is rule-based and should always be interpreted within broader market context.
Risk Disclosure
Trading involves risk.
All outputs are for educational and analytical purposes only.
Users are responsible for their own decisions, risk management, and interpretation.
Nothing in this script should be considered financial advice.
5-Year Access & Delivery The access term, payment-to-activation sequence and the TradingView username required for manual delivery.
5-Year Access & Delivery
- New-purchase access: At least five years of access — 1,827 days from purchase. One-time payment; no automatic renewal.
- One TradingView username: submit the exact username during checkout.
- Manual activation: invite-only access is enabled after payment confirmation.
This is an analytical and educational TradingView workflow. It does not connect to a broker, place trades, manage an account, provide financial advice, or guarantee results. Trading involves risk, and every decision remains the user's responsibility.
Before you buy
Clear access. Clear purpose. No signal-shop promises.
Volume Climax Trap Matrix is delivered as a TradingView Pine Script workflow for structured analysis and chart review. Access is activated manually for the TradingView username submitted at checkout.
- TradingView accessInvite-only access is enabled after payment confirmation.
- Analysis workflowDesigned for context, structure, risk review and visual discipline.
- Not auto-tradingNo broker connection, no account management and no guaranteed outcome.
Product FAQ
Is this a TradingView Pine Script workflow?
Yes. This product is an invite-only AGPro Series workflow for use inside TradingView.
Does it trade automatically?
No. AGProLabs workflows are analytical tools. They do not connect to brokers, place trades or guarantee outcomes.
How is access activated?
Access is activated manually for the TradingView username submitted during checkout after payment confirmation.
Does access include TradingView or paid market data?
No. This purchase provides invite-only access to the selected AGProLabs workflow. It does not include a TradingView subscription or paid exchange data. Check your TradingView plan, available data, chart resources and alert capabilities for your intended workflow before ordering; contact support if unsure.
Related workflows
-

Volume Flow Reversal Elite [AGPro Series]
Review a volume spike’s follow-through, recovery and invalidation.
AccessSingle workflow 5-Year Access$149.00 View workflow One 5-Year Access option. View details on the product page.
Compare other premium products (40)
Open a product to review its methodology, interface and access details.
Confirmation & Playbook
- Adaptive Market Playbook [AGPro Series]
- CME Gap Magnet [AGPro Series]
- Confluence Alert Engine [AGPro Series]
- Crypto Rotation Opportunity Matrix [AGPro Series]
- Crypto Setup Planner [AGPro Series]
- Divergence Reversal Decision Matrix [AGPro Series]
- Dynamic Channels Elite [AGPro Series]
- Edge Confidence Gauge [AGPro Series]
- Edge Consistency Gauge [AGPro Series]
- Expected Move Cone [AGPro Series]
- Market Confirmation Engine [AGPro Series]
- Market Tradability Gate [AGPro Series]
- Rejection Block Execution Planner [AGPro Series]
- Seasonal Edge Clock [AGPro Series]
- Support Resistance Continuation Matrix [AGPro Series]
- Trade Edge Profiler [AGPro Series]
- VWAP Acceptance Execution Matrix [AGPro Series]
Defense & Management
Liquidity & Reclaim
Platform Access
Risk & Execution
- Position Scaling Engine [AGPro Series]
- R-Expectancy Surface [AGPro Series]
- Risk of Ruin Engine [AGPro Series]
- Risk Reward Execution Matrix [AGPro Series]
- Target Ladder Confluence Planner [AGPro Series]
- Trade Excursion Engine [AGPro Series]
- Trade Management Planner Elite [AGPro Series]
- Trade Outcome Simulator [AGPro Series]
SMC & Structure
- Auto Fib Structure Planner [AGPro Series]
- Breaker Block Transition Planner [AGPro Series]
- Harmonic Completion Engine [AGPro Series]
- Institutional Reaction Planner Elite [AGPro Series]
- Structure Failure Recovery Matrix [AGPro Series]
- Trade Conviction Engine [AGPro Series]
- Trendline Retest Execution Matrix [AGPro Series]