
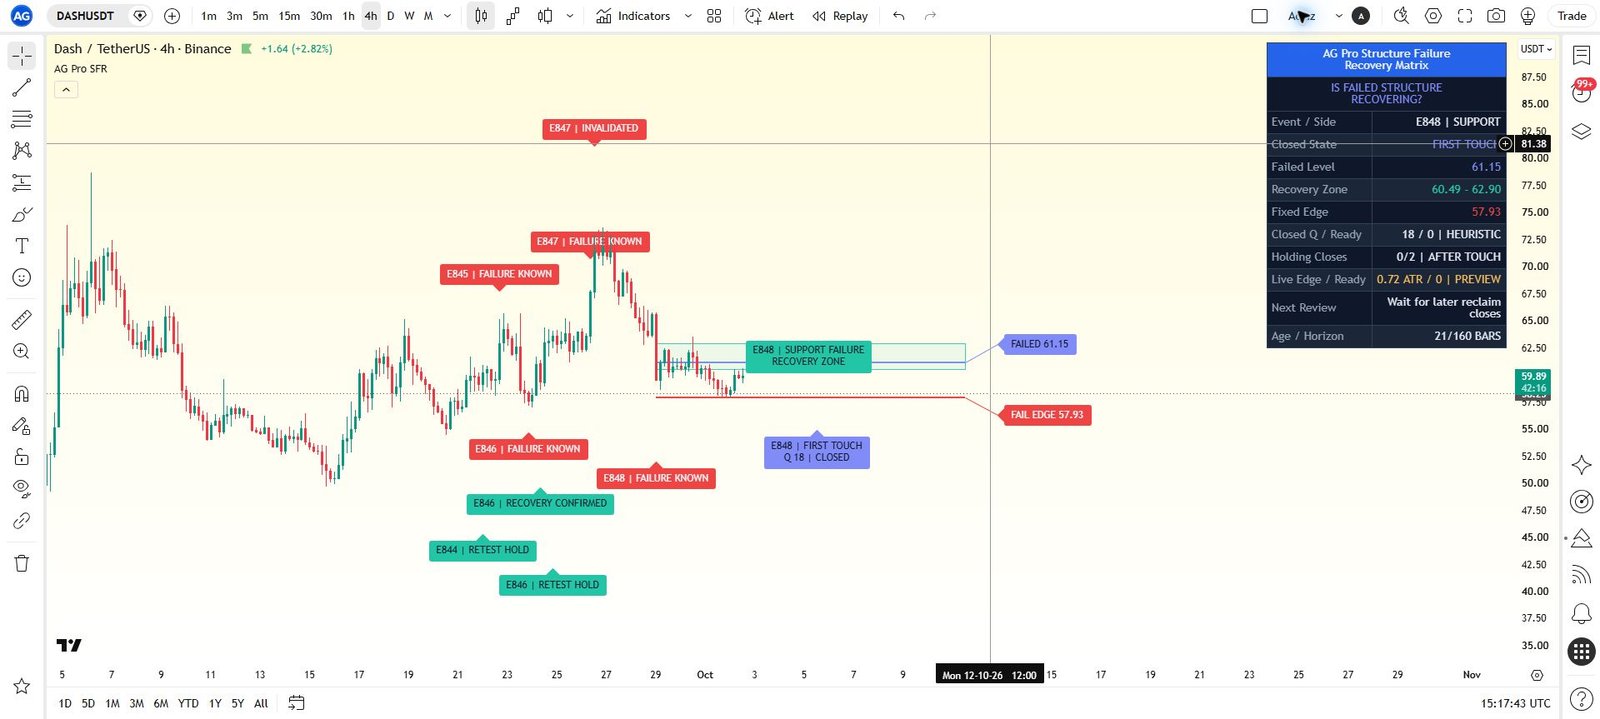

Structure recovery review
TradingView Pine Script Workflow
Structure Failure Recovery Matrix [AGPro Series]
5-Year Access, one-time payment. Manual TradingView activation. TradingView and data fees are separate.
Get Access — $149$149.00
Separate a recovery attempt from a market accepting failed structure.
Keep a broken level in view while its next phase develops. A volatility-adjusted recovery zone, readiness readings and failure pressure organize the transition around that reference.
- One focused workflow
- 5-Year Access · one-time
- Manual TradingView activation
Already paid through Whop? Get TradingView access help
View actual chart & all settings First gallery image: historical TradingView interface. Second image: illustrative cover. Open the gallery to inspect details.
Manual TradingView activation
Submit the exact TradingView username at checkout. Manual review begins after verified payment; access confirmation follows when activation is complete.
One-time payment. No subscription. Available payment methods are shown before order placement.
Need help before purchase? Ask AGProLabs →
Inside Structure Failure Recovery Matrix
Separate a recovery attempt from a market accepting failed structure.
Structure Failure Recovery Matrix starts after a qualified support or resistance level breaks. It maps the failed level, builds a volatility-adjusted recovery zone, and compares recovery readiness with failure acceptance and invalidation pressure. The result is one focused workflow around the transition that follows failure. A brief reclaim attempt, an unresolved return, and continued pressure away from the level can therefore be reviewed as different contexts rather than compressed into a single break label.
Choose with a clear purpose
What this workflow helps you inspect.
For traders focused on what happens after a qualified level breaks and whether price is recovering or accepting that failure.
- Retain the failed reference while distinguishing recovery attempts from accepted failure.
- Follow first touch, later confirmation and retest as separate stages.
- Read recovery readiness alongside invalidation, expiry and opposing pressure.
Read the detailed workflow fit
- For users studying failed support, failed resistance, and reclaim attempts after a break. It is designed for the transition after structure has already failed, not as a general all-purpose BOS/CHoCH map. The most useful starting point is a readable confirmed level and a clear question about what happened after it broke.
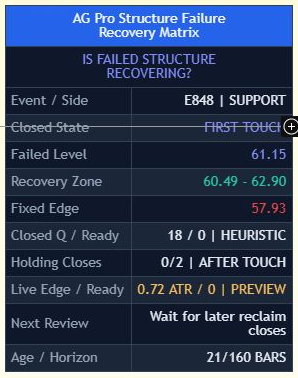 Inspect interface detail
Confirmed level and qualified failure
A broken line can be overinterpreted without a consistent definition of the level and its failure.
Volatility-adjusted recovery zone
A failed level is rarely resolved by one exact-price touch.
Failure score versus recovery readiness
A partial rebound can look convincing even while acceptance of the break remains strong.
See what each layer contributes.
Open a module to explore its purpose, practical interpretation and boundaries. Examples describe a review process; they are not promises of a trading result.
01Confirmed level and qualified failureA broken line can be overinterpreted without a consistent definition of the level and its failure.
Local pivot behavior supplies confirmed support and resistance references. A break with sufficient pressure establishes the active failed structure level. The workflow then stays centered on that reference so the chart review asks a specific question: is the market accepting this failure, or moving back toward recovery?
A practical reading
Inspect the failed support reference and the qualifying break before interpreting a later move back toward it.
Keep in view: Pivot confirmation takes time, and a level is a rule-based approximation rather than an absolute market truth.
02Volatility-adjusted recovery zoneA failed level is rarely resolved by one exact-price touch.
A recovery zone surrounds the failed reference and defines the active area for reclaim attempts and unresolved interaction. The centered badge identifies the failed side and transition state. This connects the original failure with the space in which a potential recovery is being evaluated, without implying that every return through that space has equal quality.
A practical reading
A later return into the recovery zone can become FIRST TOUCH or RECOVERY BUILDING while the transition remains unresolved.
Keep in view: The zone is not an entry order or a guaranteed area of support or resistance.
03Failure score versus recovery readinessA partial rebound can look convincing even while acceptance of the break remains strong.
Failure score incorporates distance beyond the level, persistence on the failed side, trend pressure, candle body quality, and range expansion. Recovery readiness examines pressure back toward the recovery side, zone interaction, trend response, and body quality. Reading both exposes the tension between a recovering reference and a failure the market may still be accepting.
A practical reading
RECOVERY CONFIRMED identifies the later-close recovery condition; RECOVERY LOST distinguishes subsequent loss of that recovered side.
Keep in view: These are analytical scores, not probabilities that the structure will recover or fail permanently.
04Invalidation rail and transition statesA recovery narrative can remain attractive after pressure away from the level has intensified.
The current lifecycle distinguishes failed structure, first touch, recovery building, recovery confirmed or lost, later recovery retest, and retest hold. Failure acceptance, invalidation, and expiry remain separate conditions. The badge and panel present the active owner rather than an entry-readiness command.
A practical reading
Elevated failure score with weak recovery readiness can produce FAILURE ACCEPTED rather than a recovery-oriented interpretation.
Keep in view: A state change does not execute protection or tell the user to reverse a position; abrupt moves can exceed the reference.
Understand the controls before changing them.
Explore the main controls and control groups below. Read the current TradingView Inputs and tooltips for the available values; choose a consistent configuration before reviewing its results.
Planner Mode
Selects support failure, resistance failure, or automatic review of both.
When to adjust
To study the relevant failed-side scenario.
Watch for
A filter does not establish a preferred direction.
Pivot Confirmation
Controls confirmation of local structure before it can become a failed level.
When to adjust
When comparing structural scales.
Watch for
Confirmation affects both timing and which levels qualify.
Structure Lookback
Sets the baseline for range, body, trend, and persistence measurements.
When to adjust
For a deliberate change in the context window.
Watch for
Scores from different baselines are not directly identical evidence.
Recovery Zone Width
Controls the review area's size around the failed level.
When to adjust
When comparing narrow and broad recovery interactions.
Watch for
A wider zone does not make a recovery stronger.
Recovery Strictness
Sets how demanding recovery-readiness logic is.
When to adjust
To compare requirements for a stronger recovery classification.
Watch for
Selectivity is not predictive certainty.
Failure Strictness
Controls how quickly failure score and invalidation pressure increase.
When to adjust
When reviewing sensitivity to adverse transition behavior.
Watch for
A low warning score does not remove market risk.
Minimum Label Score and Visual Preset
Filter historical attention labels and adjust annotation density.
When to adjust
When chart history hides the active transition.
Watch for
Do not judge the workflow by label quantity alone.
Complete settings reference
Open complete settings reference
Every setting, explained.
Explore each input, its source default, available choices and practical effect before changing your configuration.
The reference shows defaults in the verified source. A preset or saved chart can retain different input values. Chart captures illustrate the interface and are not a live signal or a performance record.
From first look to a documented observation.
- Identify the confirmed reference, which side failed, and the evidence behind the qualifying break.
- Locate price within or beyond the recovery zone and inspect the invalidation rail.
- Compare failure score and recovery readiness, then identify whether the current state is unresolved, recovering, or accepting failure.
- Review the broader trend and liquidity context before deciding what the transition means for an independently defined plan.
Answers specific to this workflow.
Is this the same as a general market-structure indicator?
Its documented specialty is the transition after a qualified level has already failed. It concentrates on recovery, failure acceptance, and invalidation around that active reference.
Why can a level failure and recovery remain unresolved?
Price can spend many bars around the failed reference without sufficient alignment for a stronger state. The workflow is designed to show that uncertainty rather than force a directional conclusion.
Can I study support failures separately from resistance failures?
Yes. Planner Mode selects support failure, resistance failure or automatic review of both. The chosen mode focuses the active scenario; confirmed structure and recovery conditions still govern the analysis.
Product overview and access scope
Structure Failure Recovery Matrix is a failure-to-recovery workflow designed to organize what happens after a key market structure level breaks. Instead of only marking a break or recovery attempt, the script tracks whether the failed level is recovering, accepting failure, showing invalidation pressure, or becoming inactive.
5-Year Access only. Manual activation for one TradingView username after verified payment.
Product-specific chart proof
After structure fails, is the market recovering, accepting failure, or still unresolved?
After structure fails, is the market recovering, accepting failure, or still unresolved? Structure Failure Recovery Matrix turns that question into a repeatable TradingView review process.

What it organizes
Structure Failure Recovery Matrix is a failure-to-recovery workflow designed to organize what happens after a key market structure level breaks. Instead of only marking a break or recovery attempt, the script tracks whether the failed level is recovering, accepting failure, showing invalidation pressure, or becoming inactive.
Analytical and educational use only. No auto-trading, broker execution, financial advice or guaranteed outcome.
Complete product intelligence
Understand the workflow before you activate it.
Purpose, methodology, chart language, operating conditions, controls and limitations are presented below so you can evaluate fit before purchase.
System, Purpose & Difference What the workflow exists to solve, what it produces and why its design differs from generic signal tools.
Core Idea
After structure fails, is the market recovering, accepting failure, or still unresolved?
What This Workflow Does
Structure Failure Recovery Matrix is a failure-to-recovery workflow designed to organize what happens after a key market structure level breaks. Instead of only marking a break or recovery attempt, the script tracks whether the failed level is recovering, accepting failure, showing invalidation pressure, or becoming inactive.
The script produces one active failed structure level, one recovery zone, a dashed invalidation rail, centered failure/recovery badge, recovery-readiness badge, optional failure path label, sparse historical state labels, and an AGPro decision panel.
This script does not predict future direction, automate decisions, or provide guaranteed signals. It is an analytical and educational visualization tool for reviewing failed-structure behavior with recovery and invalidation context.
Purpose & Design Philosophy
Market structure does not always fail cleanly. Sometimes a support failure is quickly reclaimed. Sometimes a resistance failure holds and becomes accepted. Sometimes the market stays unresolved around the failed level for many bars.
This script was built to answer the practical question after structure fails:
Is the failed structure recovering, accepting the failure, or still unresolved?
The design philosophy is workflow-based.
Why It Is Different
Most structure tools focus on break detection, BOS/CHoCH labels, or recovery after a market-structure shift.
This script does NOT try to be another general market structure recovery planner, breakout failure map, or invalidation-only tool.
Instead, it focuses specifically on the transition after a structure level has already failed.
It separates:
- the failed structure level
- the recovery zone around that level
- failure acceptance score
- recovery readiness
- invalidation pressure
- inactive structure conditions
- next-action workflow state
Methodology & Chart Language How context is processed and how zones, labels, colors, panels and visual states should be read.
Methodology
- Structure Level Detection
The script identifies confirmed support and resistance structure levels using local pivot behavior.
- Failure Detection
When price breaks through a qualified structure level with enough pressure, the script marks that level as the active failed structure level.
- Recovery Zone Mapping
Around the failed level, the script builds a volatility-adjusted recovery zone. This zone is the main review area for failure recovery, reclaim behavior, and unresolved structure.
- Failure Score
Failure score evaluates distance beyond the failed level, persistence on the failed side, trend pressure, candle body quality, and range expansion.
- Recovery Readiness
Recovery readiness evaluates how strongly price is moving back through or around the failed level, including recovery-side pressure, zone interaction, trend response, and body quality.
- Invalidation Pressure
Pressure beyond the failed structure is reviewed as invalidation context; the dashed rail shows where pressure away from the failed level becomes more important.
How to Read the Chart
Failed Structure Level
The failed level represents the support or resistance structure that recently broke.
Recovery Zone
The colored zone around the failed level is the active review area. It shows where recovery attempts, failure acceptance, and unresolved behavior are evaluated.
Invalidation Rail
The dashed rail marks where pressure away from the failed level becomes more important.
Centered Zone Badge
The centered badge summarizes the failed side and the current transition state.
Recovery Badge
The recovery badge summarizes recovery readiness and failure score.
Signals, States & Alerts What each visible state represents and when an alert marks a condition that deserves attention.
Signals & States
- STRUCTURE FAILURE → a qualified failed structure owner is active
- FIRST TOUCH / RECOVERY BUILDING → later recovery-zone interaction and holding evidence are developing
- RECOVERY CONFIRMED / RECOVERY LOST → recovery has met its later-close requirement or lost the recovered side
- RECOVERY RETEST / RETEST HOLD → a later retest and its holding evidence have been observed
- FAILURE ACCEPTED / INVALIDATED / EVENT EXPIRED → the active failure context remains accepted or the owner has closed
These are confirmed chart/model states, not entry instructions, fills, or future probabilities.
Best Conditions & When to Step Back Where the workflow is most useful, which conditions weaken interpretation and how context changes the reading.
When to Use
This script is most useful when failed structure matters:
- support failure review
- resistance failure review
- reclaim attempts after a failed level
- failure acceptance after a break
- invalidation review beyond failed structure
- trend continuation after failed structure
- multi-timeframe structure workflow review
It can be used across symbols and timeframes, but interpretation should always respect liquidity, volatility, and broader market structure.
When Not to Use
Avoid relying on this script in weak conditions such as:
- very low-liquidity markets
- extreme news-driven volatility
- highly fragmented sideways chop
- charts with unreliable pivot structure
- very low timeframes with unstable microstructure
- situations where broader market structure is unclear
Structure failure and recovery should not be interpreted in isolation.
Controls, Interface & Practical Workflow The main inputs, visual controls and a repeatable sequence for using the workflow without losing chart clarity.
Key Inputs
Planner Mode
Controls whether the script evaluates support failure, resistance failure, or both automatically.
Pivot Confirmation
Controls how local structure levels are confirmed before they can fail.
Structure Lookback
Controls the baseline used for range, body, trend, and persistence measurements.
Recovery Zone Width
Controls the size of the recovery zone around the failed structure level.
Recovery Strictness
Controls how demanding the recovery-readiness logic is.
Failure Strictness
Controls how quickly failure score and invalidation pressure increase.
Minimum Label Score
Controls historical label filtering.
Visual Preset
Controls chart annotation density.
Panel and Label Font Size
Control text readability for the decision panel and chart labels.
Boundaries, Limitations & Risk What the workflow does not do, where its outputs can weaken and the risk boundaries every buyer should understand.
What This Workflow Is Not
This script is not a prediction engine.
It is not a signal service.
It is not an automated trading system.
It does not provide financial advice.
It does not guarantee outcomes.
It does not replace market context, risk management, or independent analysis.
Limitations & Transparency
Structure levels are rule-based approximations of market behavior. They are not perfect market truths.
Pivot-based structure detection requires confirmation and may appear after the initial turning point.
Failure score, recovery readiness, invalidation pressure, and workflow state are analytical measures. They organize information but do not predict certainty.
Different timeframes and symbols may produce different structure behavior. Users should interpret the output within broader market context.
Risk Disclosure
Trading involves risk, including the possible loss of capital.
This script is provided for educational and analytical purposes only.
It does not provide financial advice, investment advice, or guaranteed trading outcomes.
Users are responsible for their own decisions, risk management, and independent research.
5-Year Access & Delivery The access term, payment-to-activation sequence and the TradingView username required for manual delivery.
5-Year Access & Delivery
- New-purchase access: At least five years of access — 1,827 days from purchase. One-time payment; no automatic renewal.
- One TradingView username: submit the exact username during checkout.
- Manual activation: invite-only access is enabled after payment confirmation.
This is an analytical and educational TradingView workflow. It does not connect to a broker, place trades, manage an account, provide financial advice, or guarantee results. Trading involves risk, and every decision remains the user's responsibility.
Before you buy
Clear access. Clear purpose. No signal-shop promises.
Structure Failure Recovery Matrix is delivered as a TradingView Pine Script workflow for structured analysis and chart review. Access is activated manually for the TradingView username submitted at checkout.
- TradingView accessInvite-only access is enabled after payment confirmation.
- Analysis workflowDesigned for context, structure, risk review and visual discipline.
- Not auto-tradingNo broker connection, no account management and no guaranteed outcome.
Product FAQ
Is this a TradingView Pine Script workflow?
Yes. This product is an invite-only AGPro Series workflow for use inside TradingView.
Does it trade automatically?
No. AGProLabs workflows are analytical tools. They do not connect to brokers, place trades or guarantee outcomes.
How is access activated?
Access is activated manually for the TradingView username submitted during checkout after payment confirmation.
Does access include TradingView or paid market data?
No. This purchase provides invite-only access to the selected AGProLabs workflow. It does not include a TradingView subscription or paid exchange data. Check your TradingView plan, available data, chart resources and alert capabilities for your intended workflow before ordering; contact support if unsure.
Related workflows
-
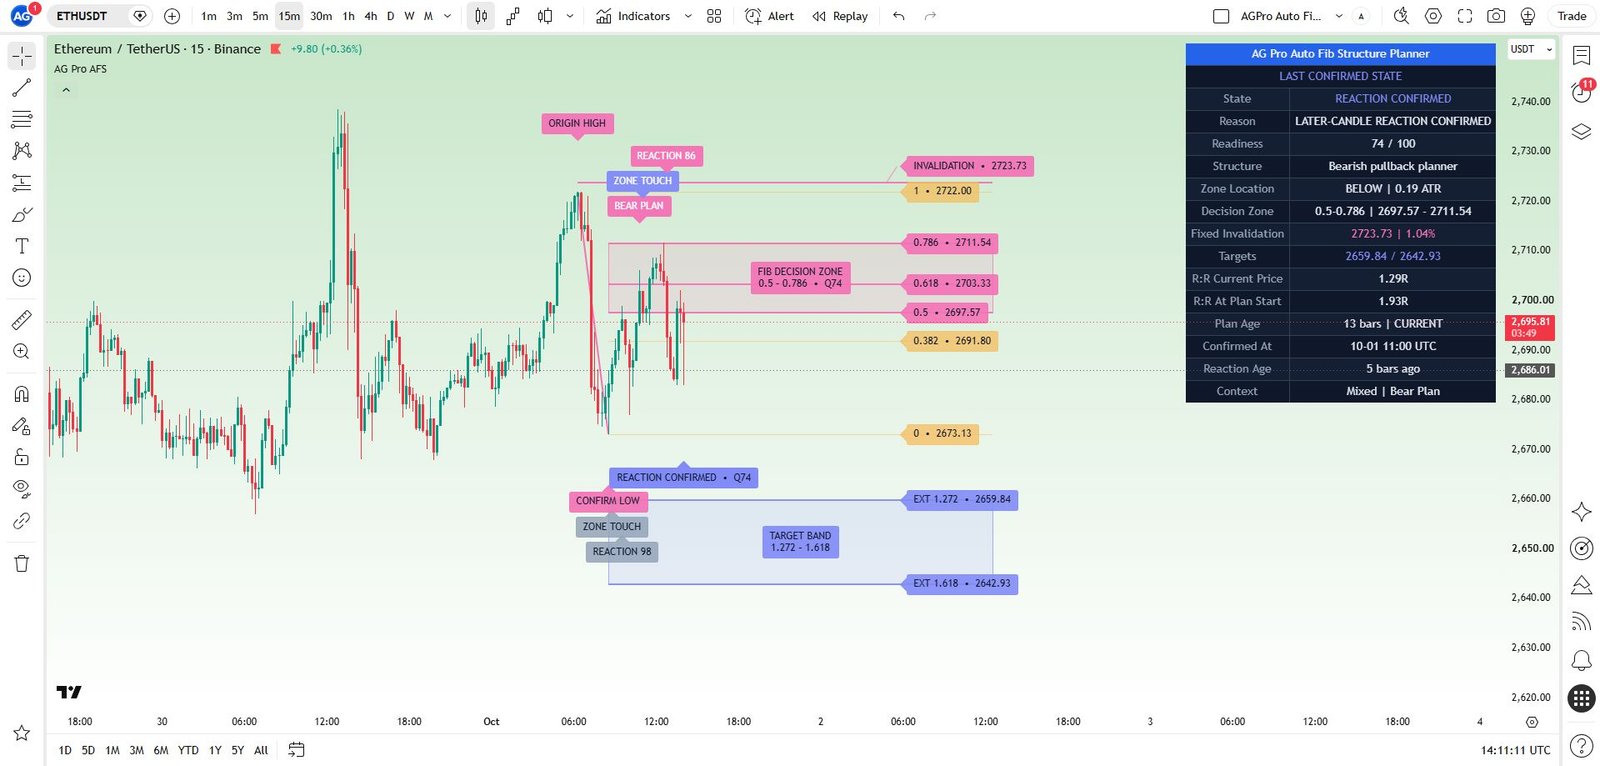
Auto Fib Structure Planner [AGPro Series]
Review pullback areas, targets and invalidation around a confirmed swing.
AccessSingle workflow 5-Year Access$149.00 View workflow One 5-Year Access option. View details on the product page. -
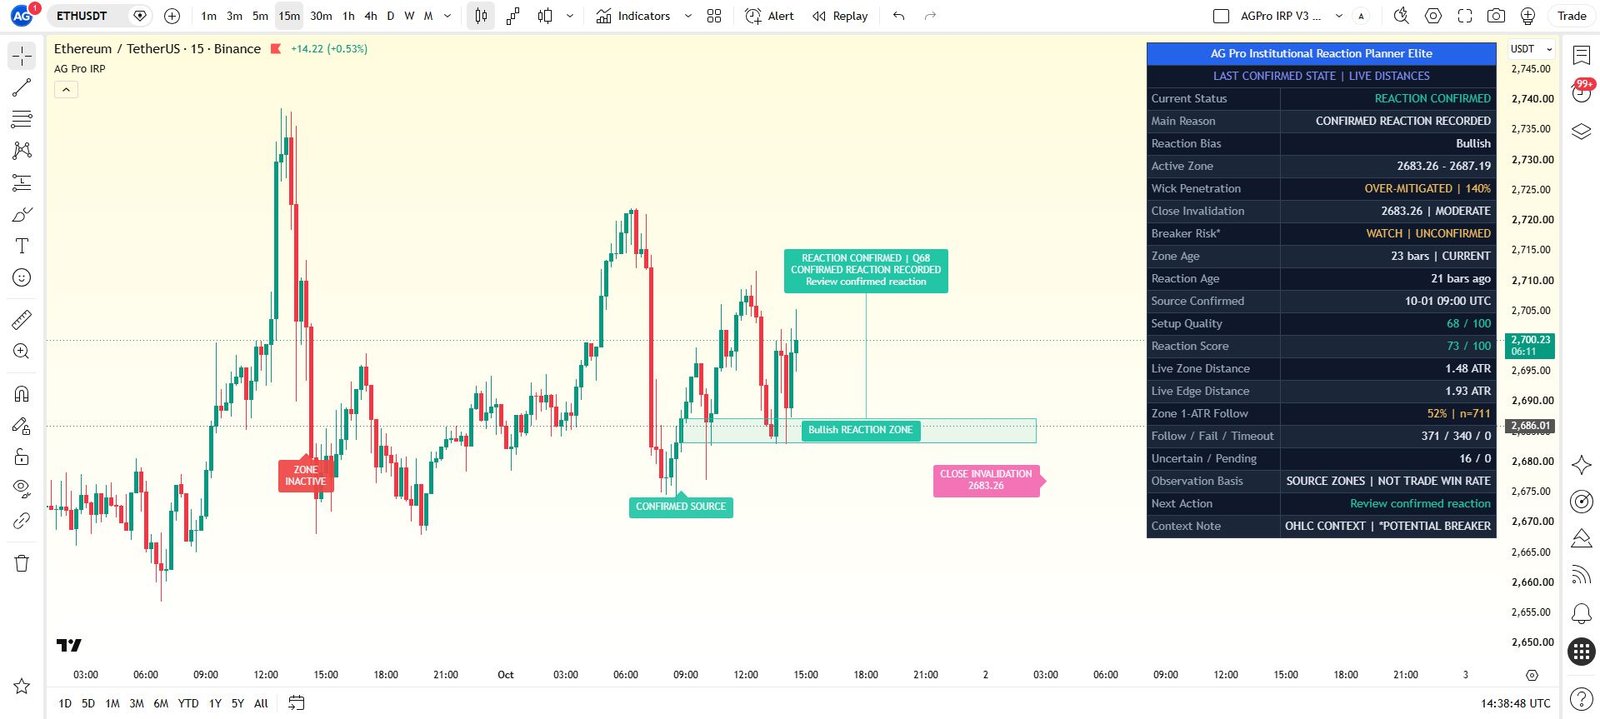
Institutional Reaction Planner Elite [AGPro Series]
Track retest depth, developing reaction and invalidation in a mapped zone.
AccessSingle workflow 5-Year Access$149.00 View workflow One 5-Year Access option. View details on the product page. -
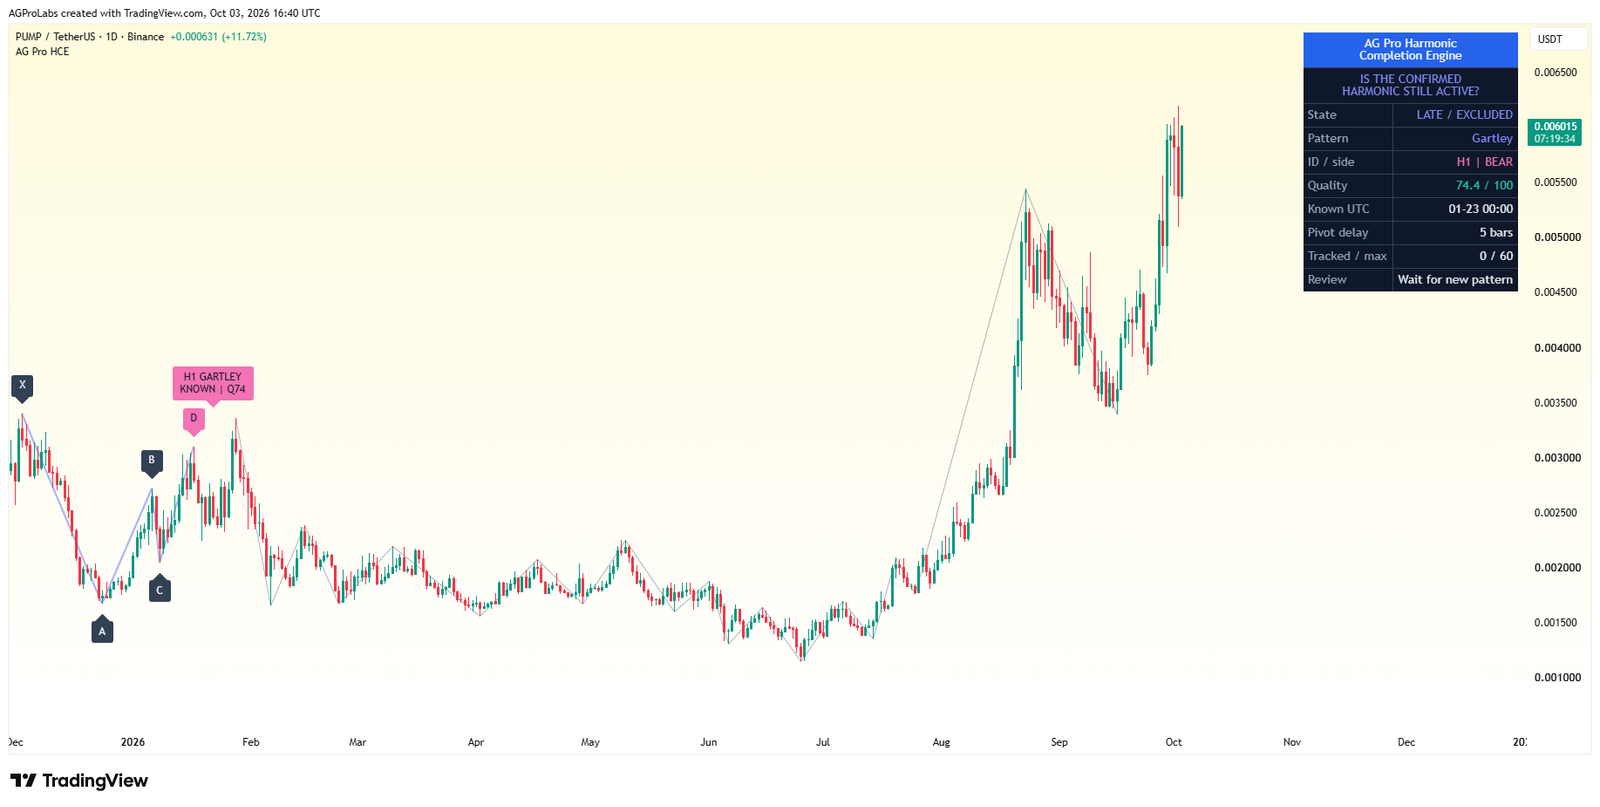
Harmonic Completion Engine [AGPro Series]
Review harmonic ratios, the potential reversal zone and current timing together.
AccessSingle workflow 5-Year Access$149.00 View workflow One 5-Year Access option. View details on the product page. -

Trade Conviction Engine [AGPro Series]
Compare six market checks before judging a setup.
AccessSingle workflow 5-Year Access$149.00 View workflow One 5-Year Access option. View details on the product page.
Compare other premium products (40)
Open a product to review its methodology, interface and access details.
Confirmation & Playbook
- Adaptive Market Playbook [AGPro Series]
- CME Gap Magnet [AGPro Series]
- Confluence Alert Engine [AGPro Series]
- Crypto Rotation Opportunity Matrix [AGPro Series]
- Crypto Setup Planner [AGPro Series]
- Divergence Reversal Decision Matrix [AGPro Series]
- Dynamic Channels Elite [AGPro Series]
- Edge Confidence Gauge [AGPro Series]
- Edge Consistency Gauge [AGPro Series]
- Expected Move Cone [AGPro Series]
- Market Confirmation Engine [AGPro Series]
- Market Tradability Gate [AGPro Series]
- Rejection Block Execution Planner [AGPro Series]
- Seasonal Edge Clock [AGPro Series]
- Support Resistance Continuation Matrix [AGPro Series]
- Trade Edge Profiler [AGPro Series]
- VWAP Acceptance Execution Matrix [AGPro Series]
Defense & Management
Liquidity & Reclaim
Platform Access
Risk & Execution
- Position Scaling Engine [AGPro Series]
- R-Expectancy Surface [AGPro Series]
- Risk of Ruin Engine [AGPro Series]
- Risk Reward Execution Matrix [AGPro Series]
- Target Ladder Confluence Planner [AGPro Series]
- Trade Excursion Engine [AGPro Series]
- Trade Management Planner Elite [AGPro Series]
- Trade Outcome Simulator [AGPro Series]