
Flagship TradingView workspace
Standalone premium product
Trading Suite [AGPro Series]
$599.00
A flagship TradingView workspace that connects market state, multi-timeframe context, structure, confirmed transitions, risk geometry and portfolio rotation—without predicting or executing trades.
Manual TradingView activation
Submit the exact TradingView username at checkout. Manual review begins after verified payment; access confirmation follows when activation is complete.
One-time payment. No subscription. Available payment methods are shown before order placement.
Need help before purchase? Ask AGProLabs →
What happens after payment?
AGProLabs verifies the order and exact TradingView username, enables invite-only access manually and confirms activation.
Will Trading Suite place trades for me?
No. Trading Suite is a manual analytical workspace and does not connect to a broker or place trades.
What do I need before purchase?
An active TradingView account and the exact TradingView username that should receive access.
Product-specific chart proof
One connected market decision system.
What changes when market state, location, confirmation, risk, and portfolio context are read as one connected system instead of five disconnected tools? Trading Suite [AGPro Series] turns that question into a repeatable TradingView review process.
What it organizes
A flagship TradingView workspace that connects market state, multi-timeframe context, structure, confirmed directional transitions, risk geometry, and portfolio rotation—without predicting or executing trades.
Analytical and educational use only. No auto-trading, broker execution, financial advice or guaranteed outcome.
Eight current real TradingView captures
See the workspace across different market conditions.
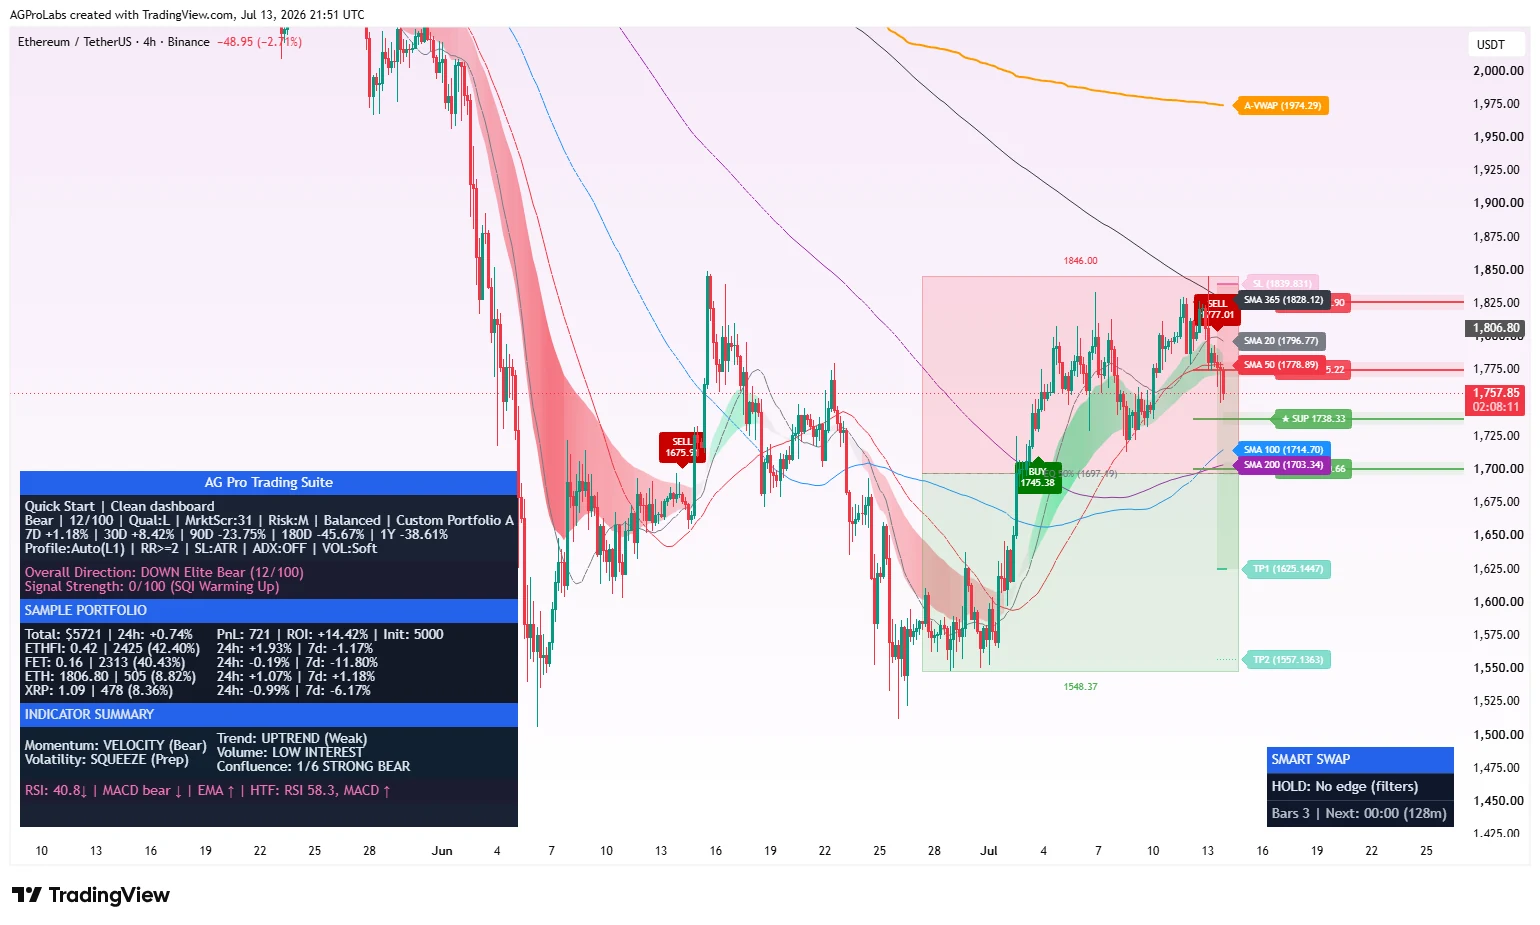
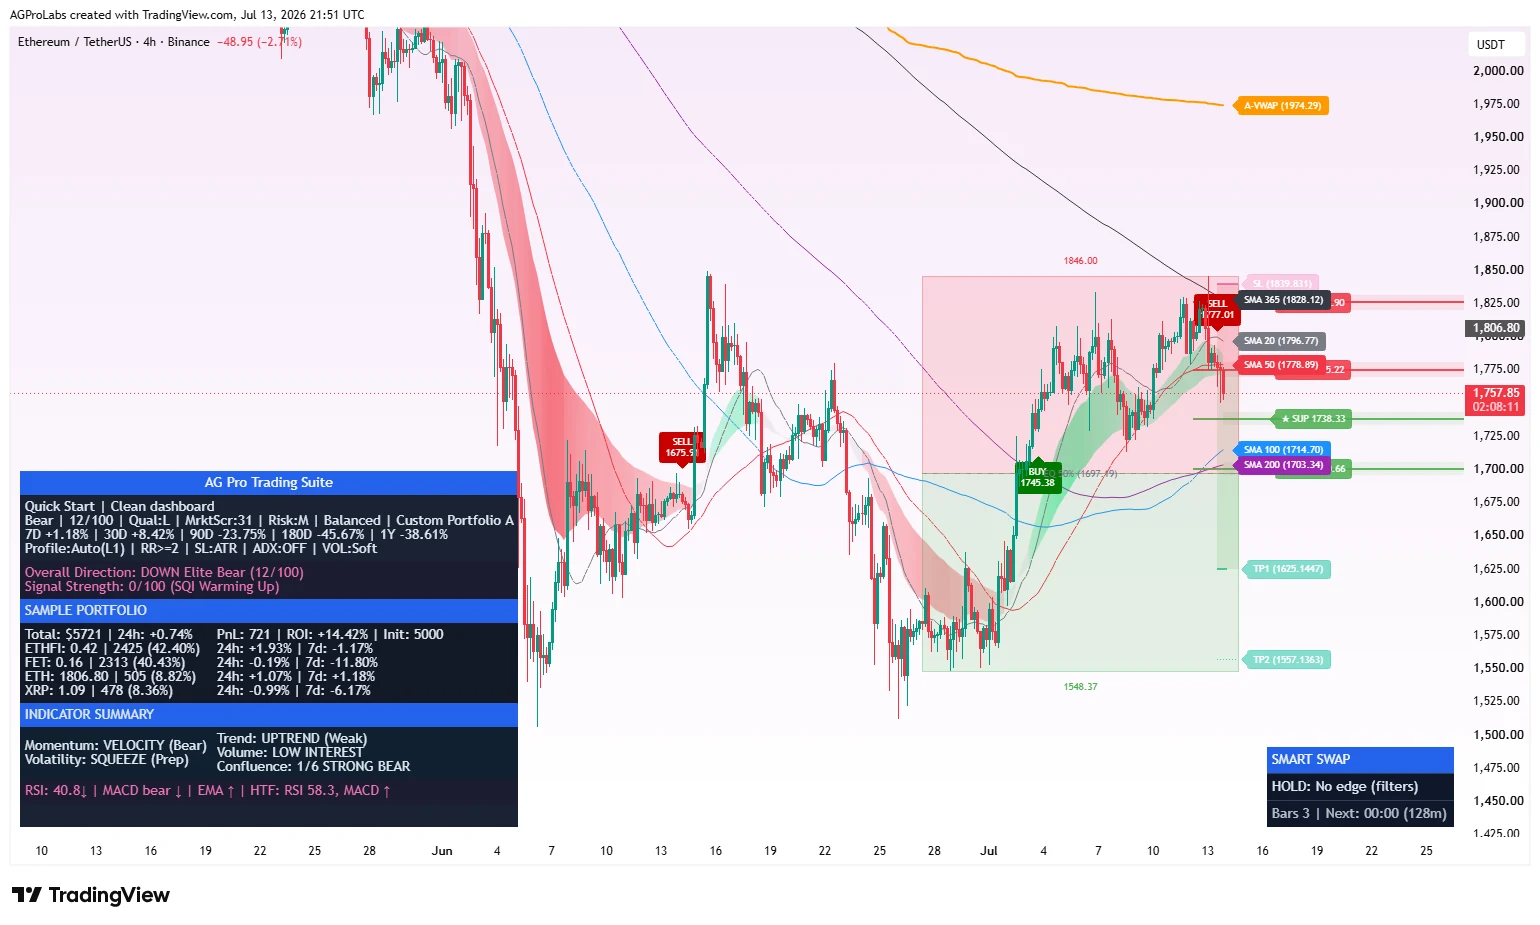
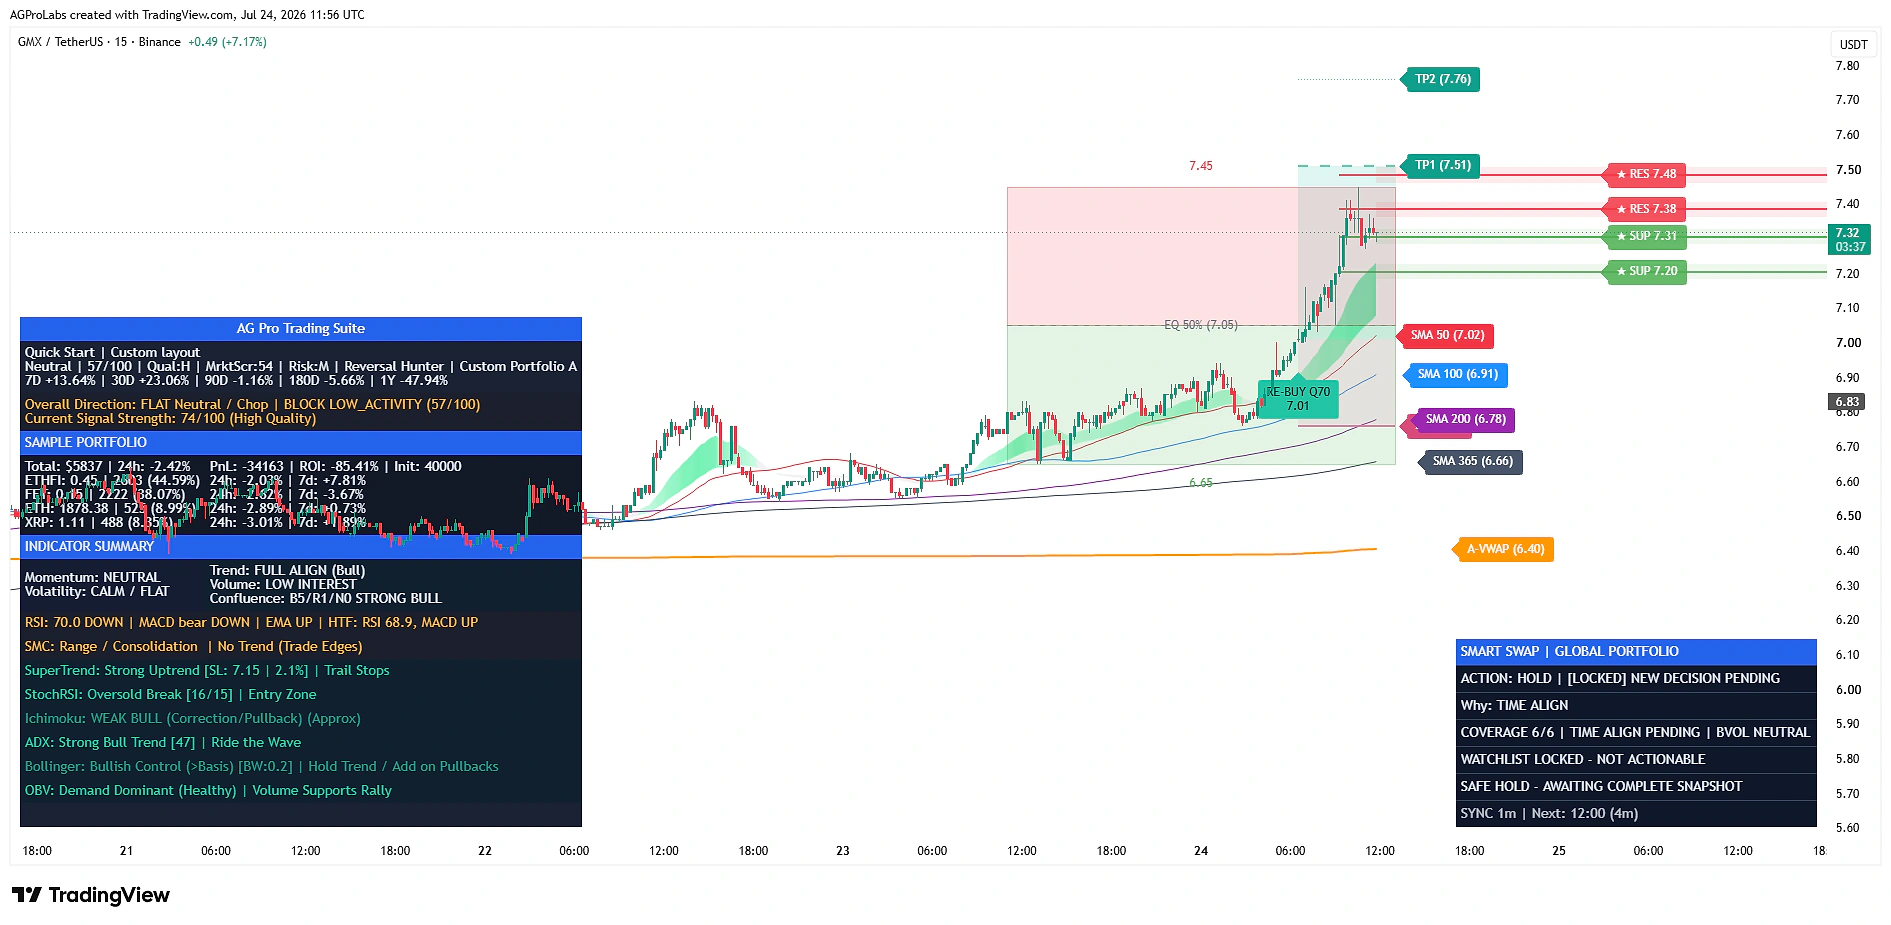
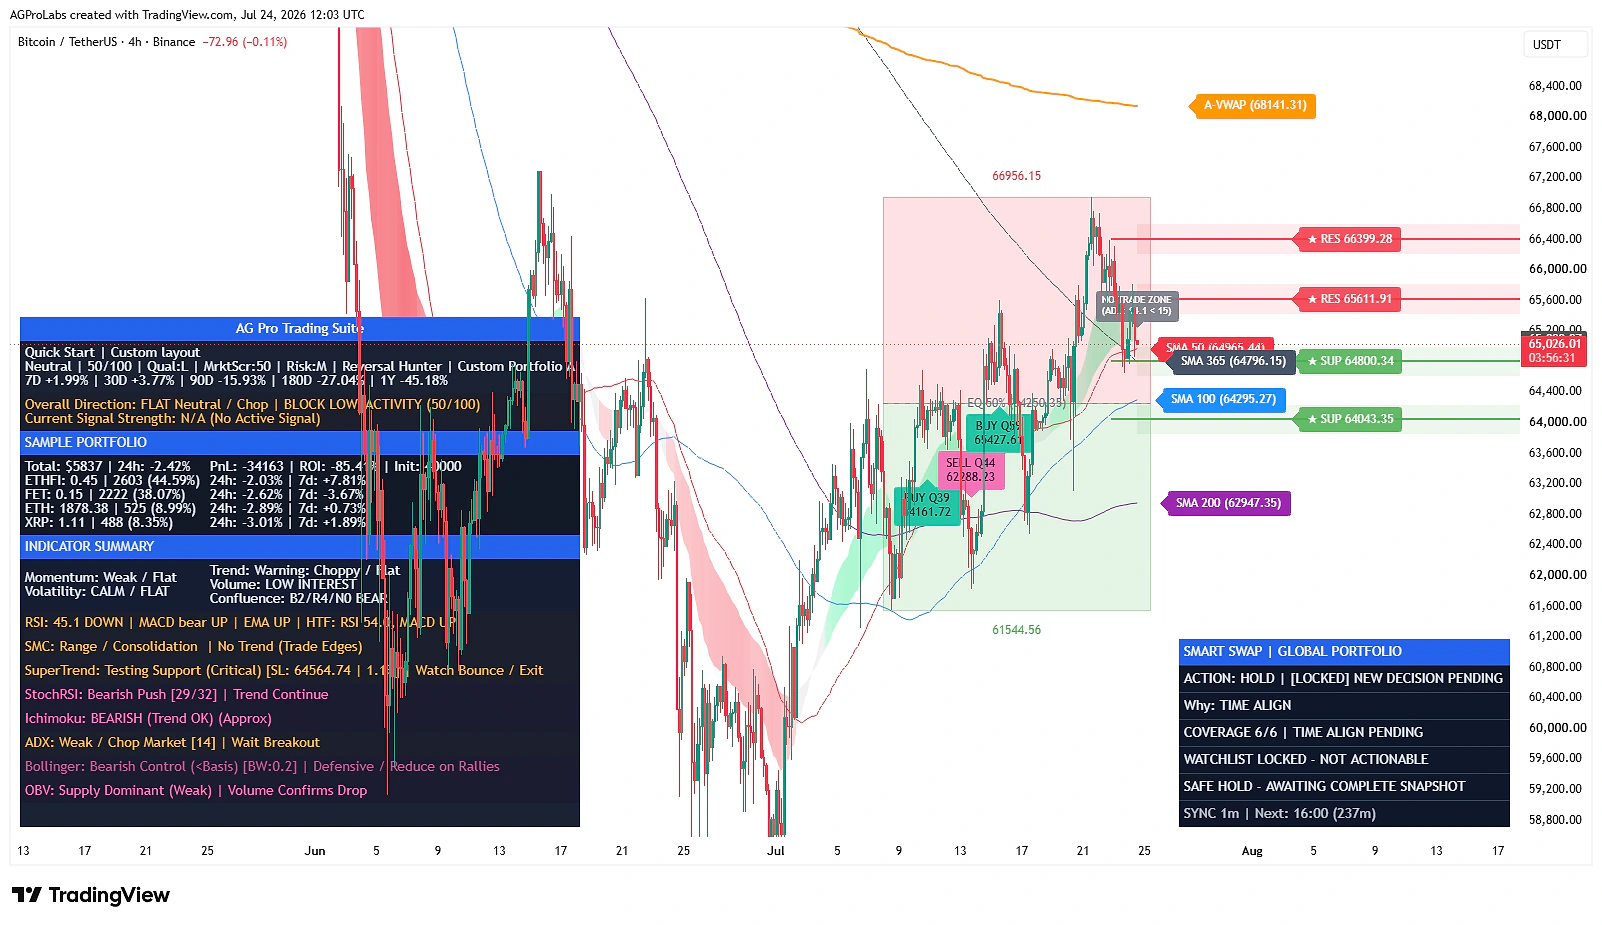
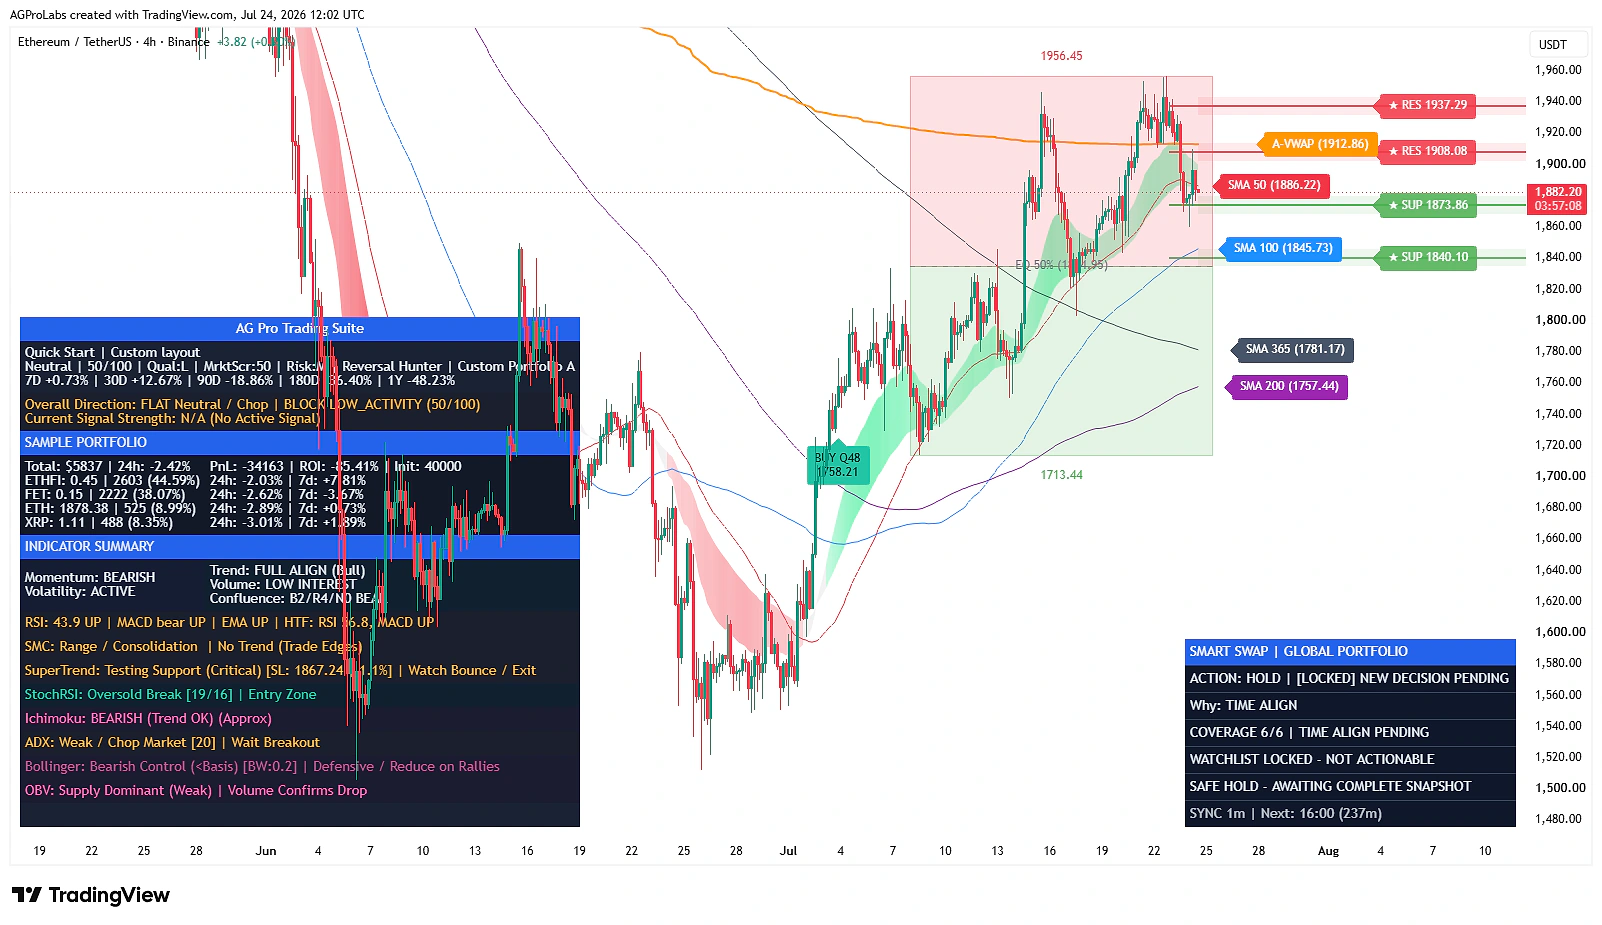
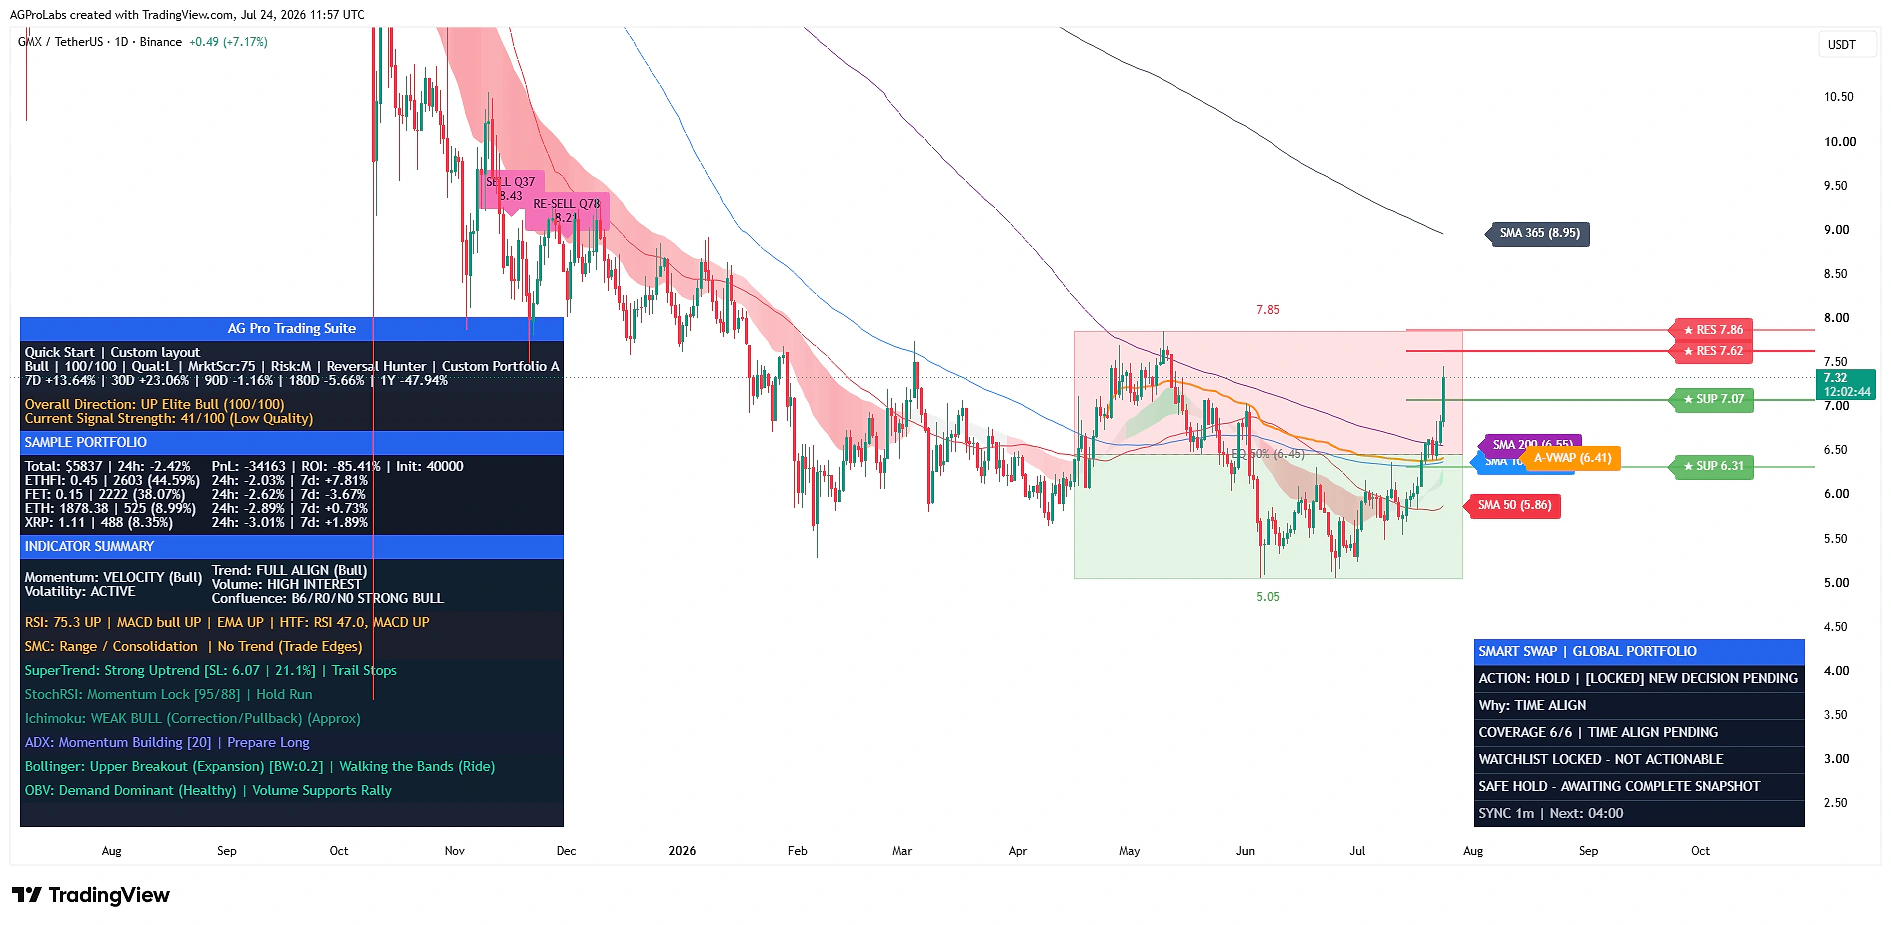
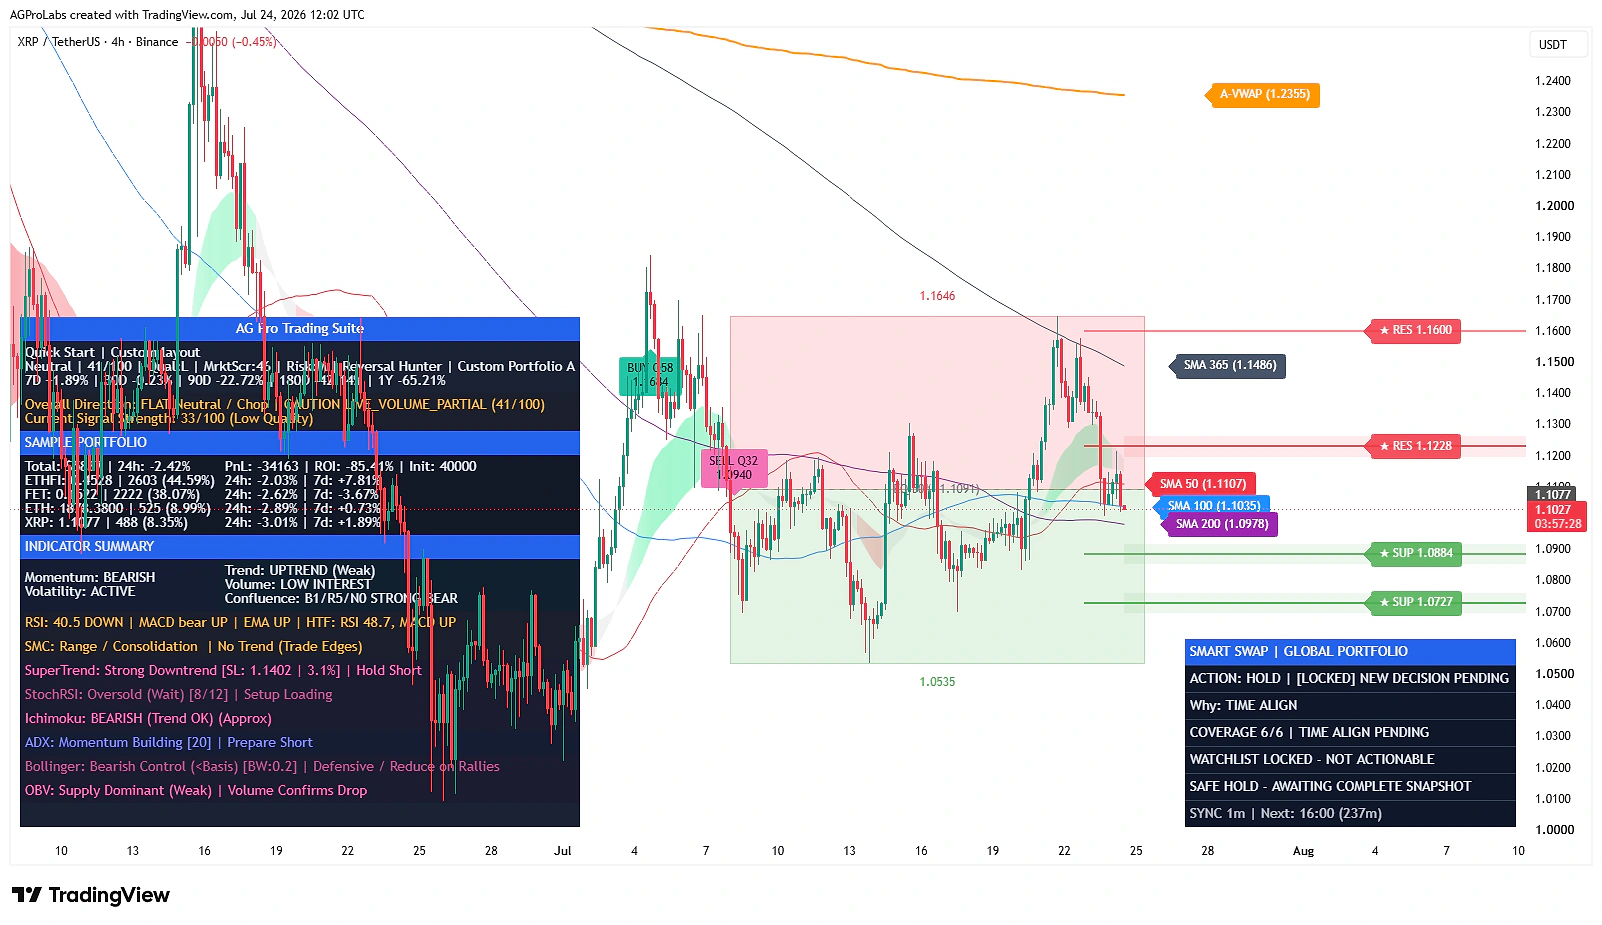
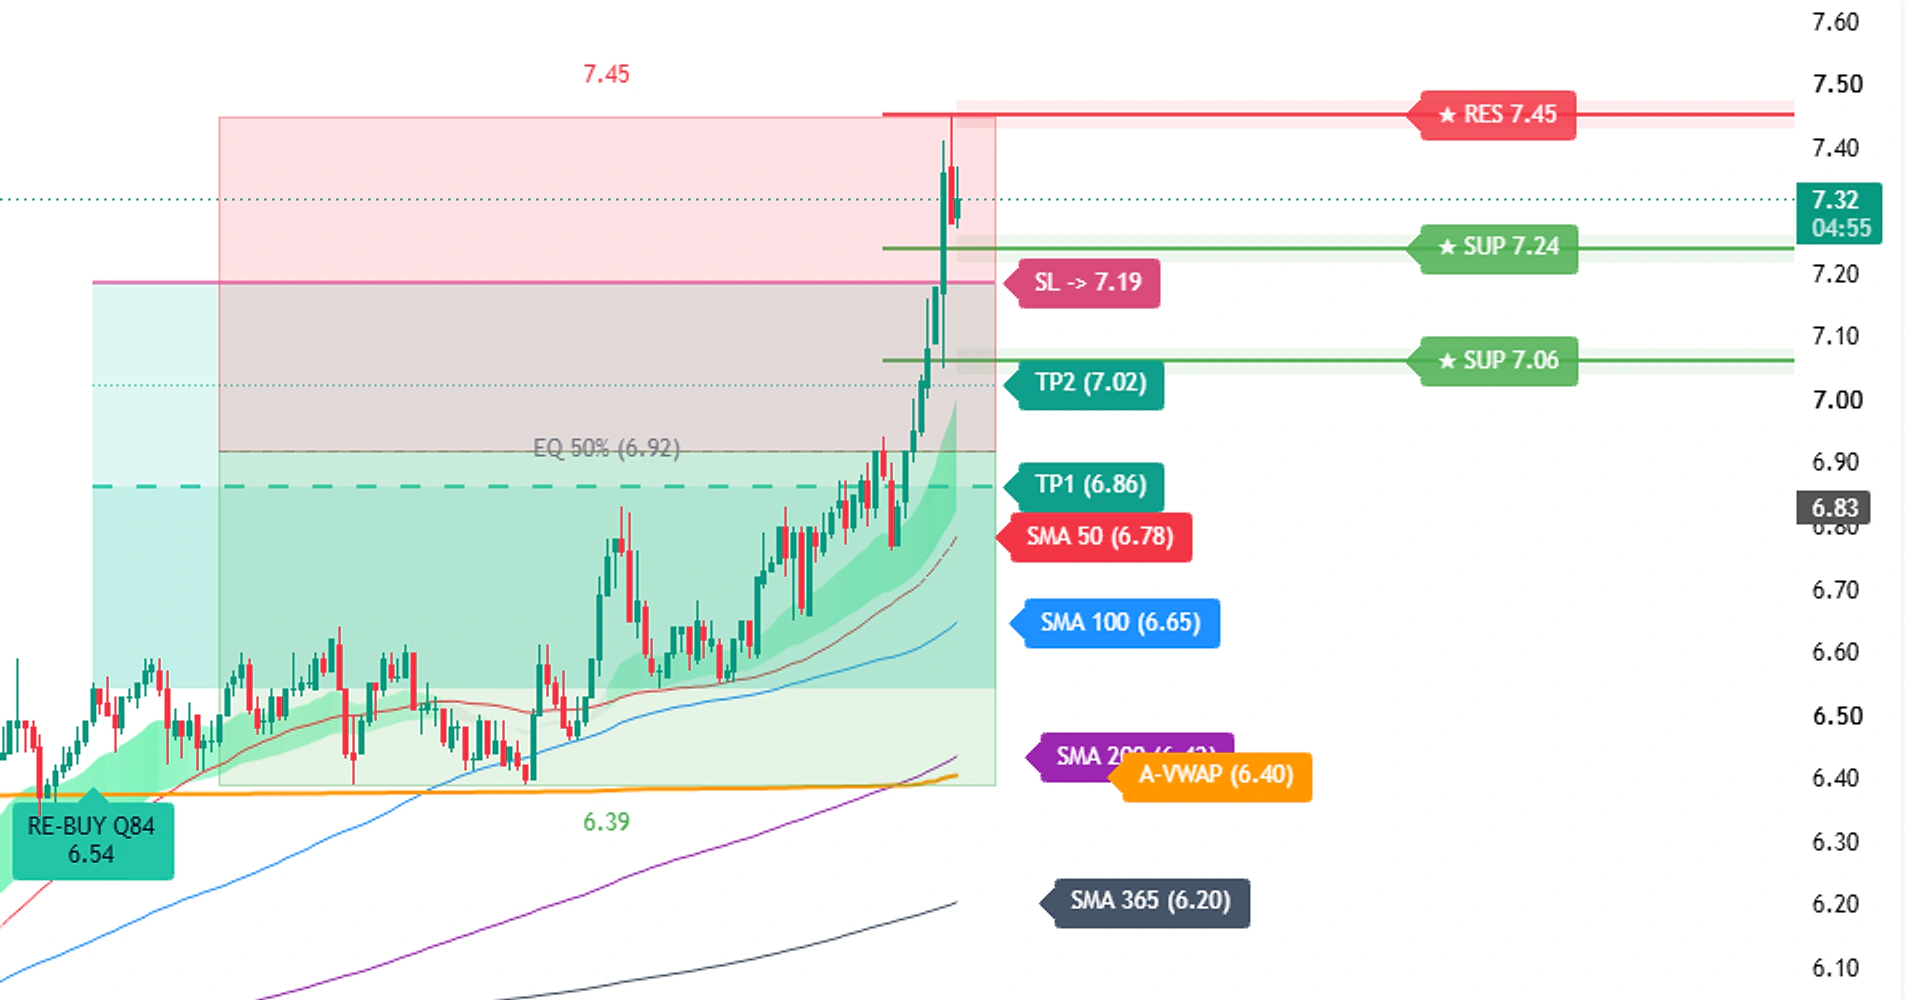
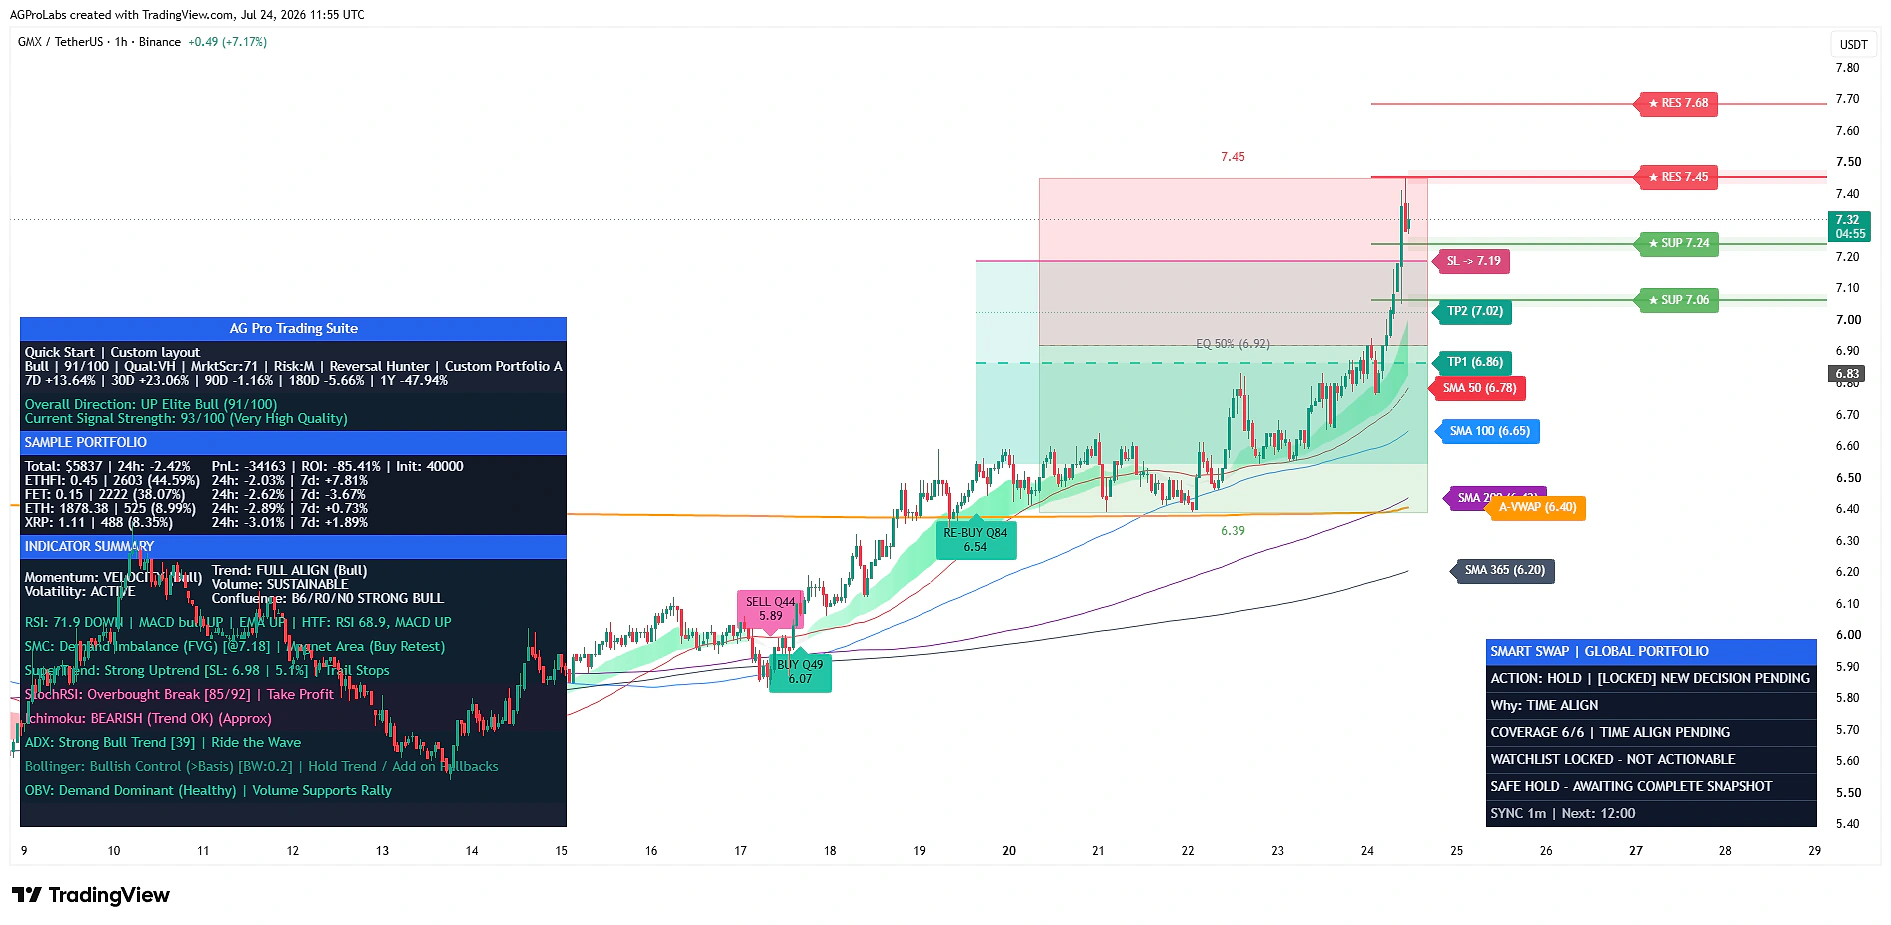
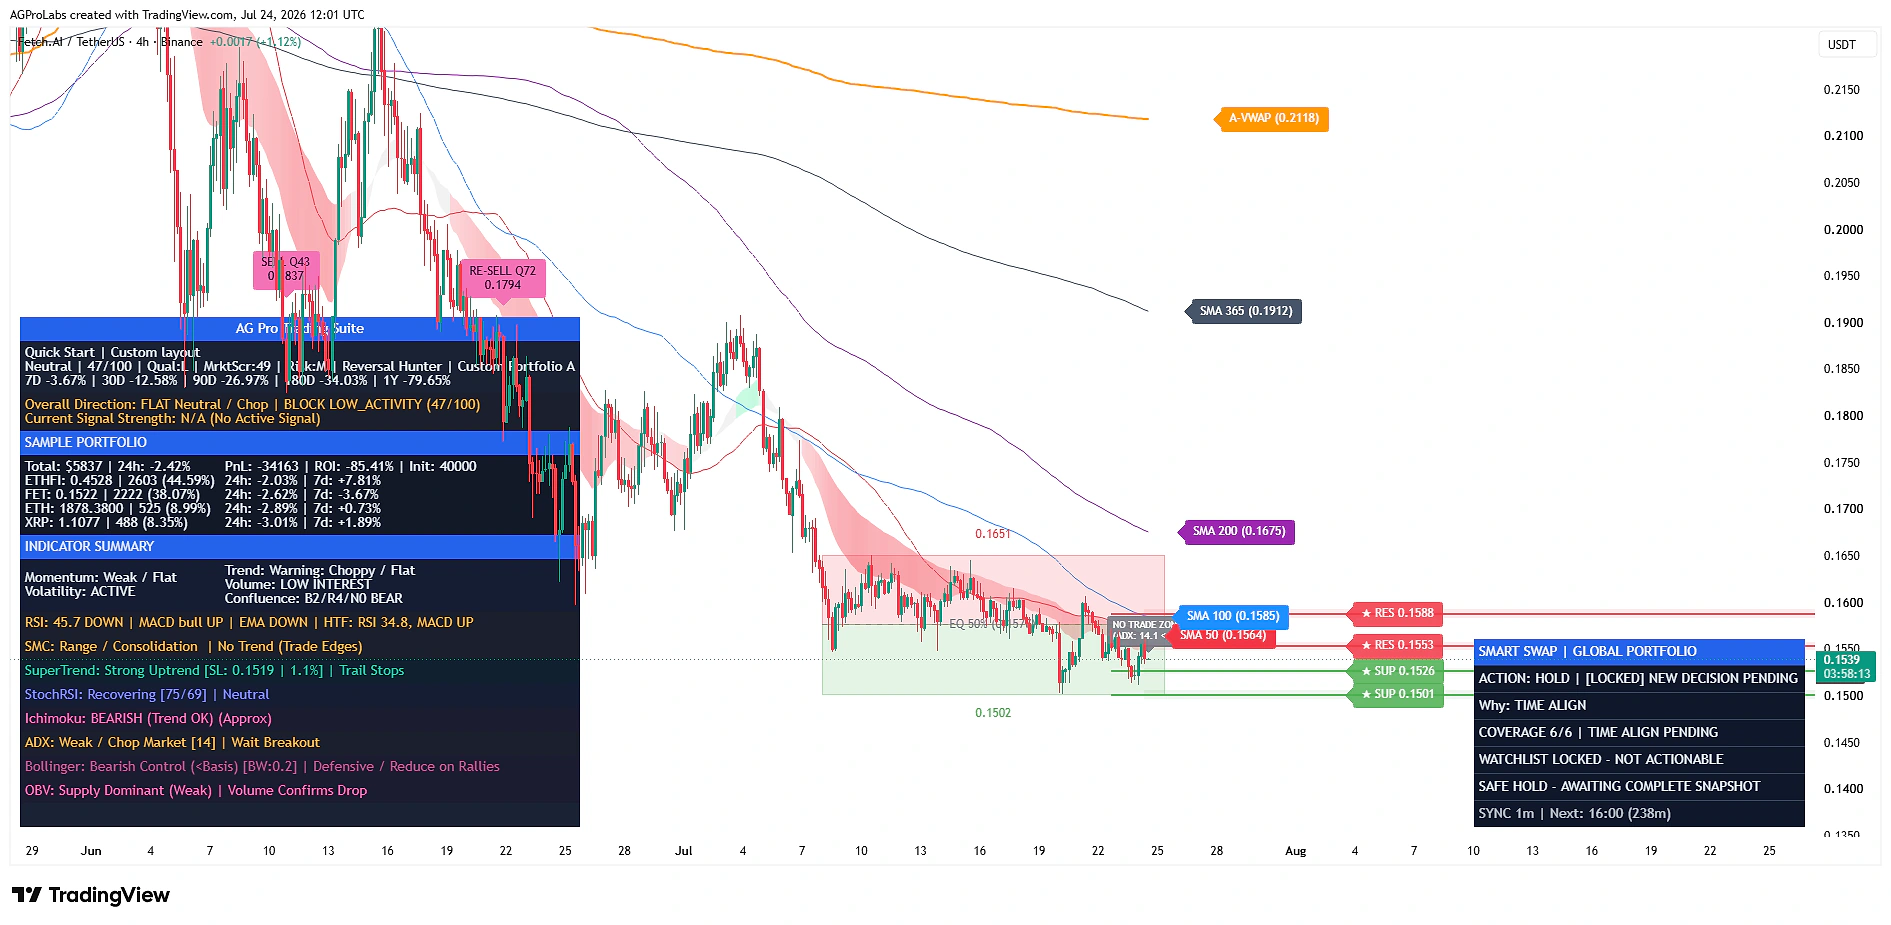
Selected ungenerated chart captures show the actual Trading Suite interface, from market state and risk to structure and Smart Swap.
Complete product intelligence
Understand the workflow before you activate it.
Purpose, methodology, chart language, operating conditions, controls and limitations are presented below so you can evaluate fit before purchase.
System, Purpose & Difference What the workflow exists to solve, what it produces and why its design differs from generic signal tools.
Core Idea
What changes when market state, location, confirmation, risk, and portfolio context are read as one connected system instead of five disconnected tools?
What This Workflow Does
A flagship TradingView workspace that connects market state, multi-timeframe context, structure, confirmed directional transitions, risk geometry, and portfolio rotation—without predicting or executing trades.
A chart can look bullish while higher-timeframe structure disagrees, participation is weak, price is pressing into liquidity, and the visible risk is poor. When each clue comes from a different tool, the trader is left to reconcile the conflict alone.
Trading Suite was built to make that analytical friction visible. It connects market state, multi-timeframe context, trend references, structure, value, confirmed directional transitions, scenario risk, and portfolio rotation inside a single review hierarchy. The purpose is not to manufacture certainty. It is to make evidence easier to compare—and uncertainty harder to overlook.
Purpose & Design Philosophy
Trading Suite is designed for discretionary traders who want to understand the whole setup before reacting to one label. It brings the major analytical questions into a single visual hierarchy: What kind of market is this? Are timeframes aligned? Where is price relative to structure and value? Does participation support the move? Where does the scenario fail?
Agreement becomes easier to recognize. Conflict becomes harder to ignore. WAIT, HOLD, and defensive states remain valid outcomes when the evidence is not coherent.
Why It Is Different
Trading Suite is not designed to add another isolated signal to an already crowded chart. It organizes independent evidence, preserves disagreement, and keeps neutral outcomes visible before a directional state receives emphasis.
- Composite market context — Read trend, momentum, volatility, participation, directional quality, and regime together instead of treating one calculation as the market verdict.
- Multi-timeframe alignment — Compare the active chart with selected broader contexts so local momentum does not silently override a conflicting higher-timeframe structure.
- Trend, VWAP, and value references — Separate short-term movement from broader directional and volume-weighted context with a modular reference stack.
- Structure, liquidity, and ranked levels — Read directional transitions in relation to recent swing events, imbalances, structural breaks, and nearby support or resistance.
- Confirmed states and visible risk — Keep the directional transition and its scenario geometry together so a label is never mistaken for a complete trading plan.
- Portfolio analytics and Smart Swap — Compare basket members without allowing relative strength to overrule a weak broader market context.
Methodology & Chart Language How context is processed and how zones, labels, colors, panels and visual states should be read.
Methodology
The system answers a sequence of independent questions. Each layer can strengthen, weaken, or challenge the layer before it. A neutral, WAIT, HOLD, or RISK-OFF result is useful information when the evidence does not support emphasis.
- Market-state classification — Trend, momentum, volatility, volume interest, and directional quality are evaluated together to describe whether the current environment is directional, ranging, compressed, active, calm, supportive, or conflicted.
- Multi-timeframe context — Selected broader timeframes reveal whether the local chart is aligned with or challenged by higher-level structure. Alignment is confluence—not certainty.
- Trend and reference mapping — A responsive trend ribbon, selected SMA horizons, anchored VWAP, session VWAP, and premium/discount regions show where price sits relative to trend, volume-weighted reference, and value.
- Structure and liquidity evaluation — Optional liquidity sweeps, fair value gaps, breaks of structure, and ranked support/resistance reveal where a directional state is forming in relation to recent market geometry.
- Confirmed directional transitions — BUY and SELL labels appear only after the active directional and quality gates are satisfied. They are confirmed analytical state markers, not orders or instructions.
- Scenario-based risk framing — Entry context, invalidation, stop references, and target geometry define the structure of a hypothesis. Older blocks are retired when they are no longer relevant, helping the chart avoid stale scenarios.
- Portfolio and Smart Swap context — Sample or custom portfolio views support live basket monitoring. Smart Swap ranks relative candidates with confidence, persistence, friction, timeframe alignment, and conflict penalties before showing a candidate—or retaining HOLD.
- Layered visual output — Chart geometry, compact state labels, and dashboard summaries form a stable information hierarchy. Advanced diagnostics can be opened for deeper review and hidden for routine use.
How to Read the Chart
- Integrated market workspace — Begin with the dashboard, then move to chart location, directional state, scenario geometry, and portfolio context. The layout is designed as a hierarchy—not a vote counter.
- Intraday state with risk attached — A confirmed directional transition is shown beside the levels that frame its hypothesis. Target and stop references describe geometry; they do not forecast a destination.
- Wide Bitcoin context — A wider view keeps trend, structure, volatility, participation, and dashboard evidence connected so one local label does not dominate the review.
- Dashboard and scenario alignment — Directional bias, quality, timeframe context, volatility, volume interest, confluence, and risk can support one another—or reveal a reason to wait.
- Multi-timeframe market context — The active daily structure is reviewed against selected broader and lower contexts. The purpose is to expose alignment and conflict, not declare certainty.
- Smart Swap with confirmed data — Relative candidates are filtered by confidence, persistence, friction, market context, and conflicts. HOLD remains the correct output when a candidate is not sufficiently qualified.
- TP, SL, and invalidation geometry — The risk block makes the analytical boundary visible beside the active state. It does not calculate personalized position size or account risk.
- Balanced routine analysis view — The default visual hierarchy keeps price primary while the supporting ribbon, references, labels, and dashboard remain available without overwhelming the chart.
- Support, resistance, and value context — Ranked levels and premium/discount regions show where a state is developing. A support line is a reference—not a promise that price will hold.
- Confirmed directional transition — A bar-close confirmed state marker identifies a transition that passed the active gates. It still requires independent review of market quality, location, liquidity, and risk.
- Complete workspace reserve view — The full system can be opened for diagnostic depth or simplified for routine review. Every module supports manual interpretation; none executes a trade.
Signals, States & Alerts What each visible state represents and when an alert marks a condition that deserves attention.
Signals & States
Every state is context—not an instruction.
- BUY / SELL — A confirmed bullish or bearish directional transition passed the active filters.
- BULL / BEAR / NEUTRAL — The current composite directional classification.
- TRENDING / RANGING / CHOP — The structural environment under the active regime logic.
- SQUEEZE / ACTIVE / CALM — A volatility-state interpretation under the selected framework.
- STRONG / WEAK / LOW INTEREST — A simplified participation or supporting-volume summary.
- NOW / WAIT DIP / AGGRESSIVE / CAUTION — Timing and friction context around a developing condition—not a trade command.
- CANDIDATE / WATCH / HOLD — The current Smart Swap qualification state inside the selected basket and strategy.
- RISK-OFF / DEFENSIVE — A market or portfolio condition that favors caution and reduced rotation emphasis under the active rules.
Alerts Logic
Alerts call attention to a state change. They do not trade it.
Alert conditions are available for confirmed bullish and bearish transitions, general directional state changes, Smart Swap confirmations, watch states, and HOLD updates. Structured event messages can support a user-maintained notification workflow. The current unfinished bar can still evolve; users should understand whether each alert reflects a developing or confirmed state.
Alerts do not place orders, calculate position size, manage risk, or provide personalized trade instructions.
Best Conditions & When to Step Back Where the workflow is most useful, which conditions weaken interpretation and how context changes the reading.
When to Use
Where Trading Suite adds the most analytical value
- Trend continuation review — Compare a pullback or continuation state with timeframe alignment, quality, participation, structure, and nearby invalidation.
- Range, chop, and breakout review — Use regime state, structure events, liquidity references, and ranked levels to distinguish directional clarity from noise.
- Location-driven setup review — Evaluate reactions near VWAP, SMA, value zones, support/resistance, fair value gaps, or recent liquidity events.
- Risk-first scenario planning — Keep invalidation and target geometry visible before treating a directional state as worth further attention.
- Multi-timeframe conflict detection — Identify when a compelling local move lacks support from the selected broader context.
- Portfolio rotation review — Compare selected candidates with a market gate and explicit WATCH, HOLD, and defensive outcomes.
When Not to Use
Know when the chart is not providing dependable context.
Trading Suite cannot repair weak market data, remove execution risk, or make an abnormal market behave normally. A professional workflow includes conditions in which the correct response is to wait.
- Extremely illiquid instruments, unreliable prints, or wide spreads
- Very noisy lower timeframes with weak data quality
- Abnormal volatility events that can rapidly break recent relationships
- Newly listed instruments with limited historical context
- Symbols with inconsistent exchange feeds
- Situations where liquidity, slippage, fees, leverage, or account constraints are unknown
- Any use case that expects a label, level, or score to replace independent judgment
Controls, Interface & Practical Workflow The main inputs, visual controls and a repeatable sequence for using the workflow without losing chart clarity.
Key Inputs
- Visual modules — Independently control the ribbon, SMA, anchored VWAP, session VWAP, directional labels, risk blocks, SMC drawings, value zones, support/resistance, dashboard, portfolio, and Smart Swap.
- Analysis mode and risk profile — Adjust how selective and information-rich the analytical workflow becomes. A defensive profile changes thresholds; it does not set or reduce real account risk.
- Coin profile and timeframe pack — Use automatic or manual market profiles and select which broader timeframes contribute to the context framework.
- SMC history depth — Choose a restrained recent-structure view or expose a wider historical structure window when diagnostic depth matters more than visual simplicity.
- S/R and target density — Control how many ranked levels and scenario targets are shown. More levels add context but can reduce first-glance clarity.
- Close-aware calculation — Use completed-bar options for the broader workflow and confirmed-data Smart Swap states when stability is preferred over intrabar responsiveness.
- Smart Swap strategy and basket — Select Balanced, Reversal Hunter, Defensive Rotation, or Trend Continuation behavior and compare preset or custom candidate universes.
- Interface controls — Adjust panel location, theme, visibility, text size, and label density while keeping price as the primary visual object.
Boundaries, Limitations & Risk What the workflow does not do, where its outputs can weaken and the risk boundaries every buyer should understand.
What This Workflow Is Not
- Guaranteed profit, win rate, or market outperformance
- Prediction of future price movement
- Automated execution, broker connectivity, or account management
- Personalized position sizing or financial advice
- Sample Portfolio results presented as audited performance
- Smart Swap candidate presented as an instruction to rotate
Trading Suite is an analytical and educational TradingView tool. It does not predict price, place trades, manage risk for the user, or guarantee outcomes.
Limitations & Transparency
Designed to expose uncertainty—not hide it.
All modules operate on historical and current chart data. Outputs can change when the active bar changes, a higher timeframe completes, settings are modified, or a different exchange feed is selected. Confirmed-data options reduce selected intrabar changes; they do not make an interpretation infallible.
Support, resistance, value zones, structure drawings, and risk geometry depend on the selected instrument, timeframe, profile, and lookback. Levels can fail. Regimes can change. Volatility shocks can invalidate relationships that previously appeared stable.
Smart Swap compares candidates only within the selected basket and strategy. Its result depends on symbol quality, market context, thresholds, persistence, and conflicts. HOLD is expected whenever the evidence is insufficient.
The Sample Portfolio is an illustrative live basket that demonstrates the interface. It is not an audited track record, model account, investment recommendation, or evidence of historical performance.
Risk Disclosure
Trading and investing involve substantial risk, including the possible loss of capital. Market conditions, leverage, liquidity, slippage, fees, execution delay, and data differences can materially affect real outcomes.
Trading Suite is provided for educational and analytical purposes only. It is not financial advice or an investment recommendation. Users remain solely responsible for their own research, position sizing, execution, and risk limits.
Lifetime Access & Delivery The access term, payment-to-activation sequence and the TradingView username required for manual delivery.
Lifetime Access & Delivery
- One-time $599 Lifetime Access with no recurring subscription.
- Invite-only access for the exact TradingView username submitted at checkout.
- Manual activation after verified payment and username review.
- Founder-led activation and first-setup support.
- Trading Suite is available as a standalone product and is included in AGPro Complete Platform.
This product does not connect to a broker, place trades, manage an account, provide financial advice, or guarantee results.
Before you choose access
One flagship workspace. A precise analytical boundary.
Trading Suite [AGPro Series] supports structured TradingView analysis with multi-factor context, chart structure, risk blocks and portfolio analytics. Access is activated manually for the TradingView username submitted at checkout.
- Lifetime product$599 one-time; available standalone and included in AGPro Complete Platform.
- Manual activationInvite-only TradingView access is enabled after confirmed payment and username review.
- Analytical useNo broker connection, auto-trading, financial advice or guaranteed outcome.
Trading Suite FAQ
Which option includes Trading Suite?
Trading Suite is available as a standalone Lifetime Access product and is included in AGPro Complete Platform. Single Workflow purchases do not include Trading Suite.
Does Trading Suite place trades automatically?
No. It is an analytical TradingView workspace. It does not connect to a broker, place trades or manage an account.
What access term is available for Trading Suite?
Trading Suite is offered with Lifetime Access for a one-time $599 purchase.
How is access activated?
AGProLabs activates invite-only access manually for the exact TradingView username submitted during checkout after payment confirmation.
What support is included with Lifetime Access?
Founder-led activation and first-setup support are included. AGProLabs verifies the submitted username, confirms access and helps resolve first-access or setup questions. This support does not include trading signals, financial advice or managed trading.