
TradingView Technical Analysis: A Practical Workflow Guide
Learn how to turn TradingView charts, indicators, multi-timeframe context and alerts into a coherent manual analysis workflow.
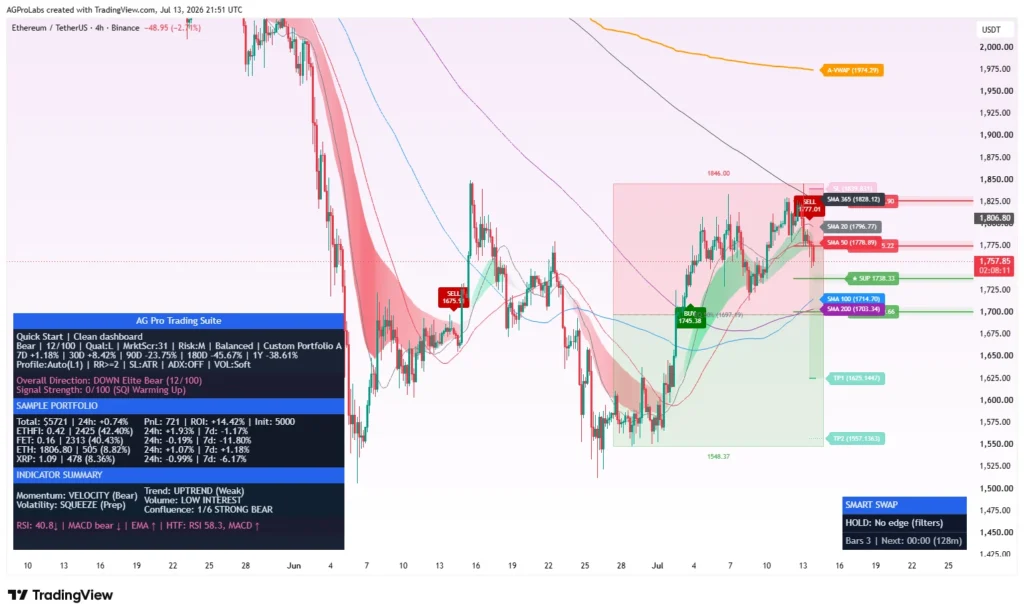
TradingView combines charting, market data, technical indicators, alerts and Pine Script in one platform. The challenge is not gaining access to more tools. The challenge is arranging those tools so each one answers a different question and the chart remains readable.
What TradingView does
TradingView provides browser-based and app-based charting across multiple asset classes and exchanges. Pine Script is TradingView’s programming language for building indicators, strategies and libraries that run on its servers. Published scripts can be open-source, protected or invite-only, depending on the publisher and access model.
An indicator transforms chart data into visual or numerical context. It does not know the user’s account, objectives or risk tolerance. Even sophisticated dashboards remain analytical interfaces rather than personal advice.
Design the workspace around questions
Before adding indicators, define the questions your workspace must answer:
- What is the broader market state?
- Where is price relative to important structure or value?
- What evidence confirms or challenges the current interpretation?
- Where would the scenario become invalid?
- Is this symbol worth attention compared with alternatives?
If two indicators answer the same question using closely related inputs, they may create the illusion of independent confirmation. A strong workspace favors complementary evidence over visual quantity.
Use multi-timeframe analysis without searching for agreement
A common workflow begins with a broader timeframe for regime and structure, then uses the active timeframe for location and a lower timeframe only when execution detail is necessary. The objective is to expose conflict rather than hide it.
For example, a short-term bullish transition inside a higher-timeframe bearish structure is not automatically wrong. It describes a different analytical situation from alignment across both timeframes. A tool such as Trading Suite places selected timeframe states in the same workspace so the conflict remains visible.
Separate overlays, oscillators and decision states
Neither category should dominate the chart. Price remains the primary object. Use colors consistently, remove stale drawings and hide advanced modules when they are not needed for the current review.
Treat alerts as attention markers
TradingView alerts can notify the user when a condition occurs. They are most useful when the trigger is explicit and the next step is manual review. An alert should answer “what changed?” rather than imply “what must I trade?”
- Understand whether the alert is intrabar or bar-close confirmed.
- Confirm the symbol and exchange feed.
- Recheck the broader timeframe and current volatility.
- Inspect liquidity, spread and execution conditions.
- Apply independent account-risk rules before any action.
Where Pine Script adds value
Pine Script makes it possible to apply the same analytical rules consistently across charts. It can calculate technical conditions, draw objects, build tables and create alert conditions. That consistency is useful for repeatable review, but calculation limits and data availability still matter.
Multi-symbol tools must manage TradingView’s request and execution constraints. Crypto Setup Planner, for example, works with an active 39-symbol universe and converts the results into a ranked planning table rather than attempting to display every possible market at once.
Build a clean chart hierarchy
- Price first: candles and current structure must remain readable.
- Context second: use a restrained set of trend, value or channel references.
- State third: show the most important label or dashboard summaries.
- Risk beside the idea: keep invalidation and scenario levels close to the relevant condition.
- Diagnostics on demand: expose deeper metrics only when investigating a setup.
Dynamic drawings require maintenance. Old levels and broken channel structures can become visual debt. Dynamic Channels Elite ranks channel families and nearest rails to keep attention on currently relevant geometry.
How to evaluate a TradingView script before relying on it
- Read the complete description, methodology and limitations.
- Verify whether the script is open-source, protected or invite-only.
- Understand when outputs update and whether they can change intrabar.
- Test different symbols, timeframes and market conditions.
- Check whether neutral, WAIT or risk states are allowed.
- Reject guaranteed results, unexplained performance claims or pressure to bypass independent review.
A practical TradingView review sequence
Open with a market-state dashboard, check the broader timeframe, map structure and value, inspect participation, then define confirmation and invalidation. Only after those steps should relative opportunities or lower-timeframe execution detail be considered. Save the layout so the sequence stays consistent across sessions.
Sources and further reading
- TradingView: What is Pine Script?
- TradingView: Technical analysis essentials
- Official Pine Script documentation
Educational and risk disclosure
This guide is educational and analytical. It is not financial advice, a recommendation, a prediction, or a promise of results. Markets involve risk, including loss of capital. Verify information independently and remain responsible for your own decisions, execution and risk limits.
See the systems behind the framework.
Review the real interfaces, methodology, limitations and access terms before deciding whether an AGProLabs workflow fits your process.