

Supply and demand transitions
TradingView Pine Script Workflow
Supply Demand Flip Matrix [AGPro Series]
5-Year Access, one-time payment. Manual TradingView activation. TradingView and data fees are separate.
Get Access — $149$149.00
Follow a supply–demand zone through acceptance, rejection, and role change.
Give a supply or demand zone a clear follow-up process. The active role, zone range and flip score keep acceptance, rejection and invalidation context together during a revisit.
- One focused workflow
- 5-Year Access · one-time
- Manual TradingView activation
Already paid through Whop? Get TradingView access help
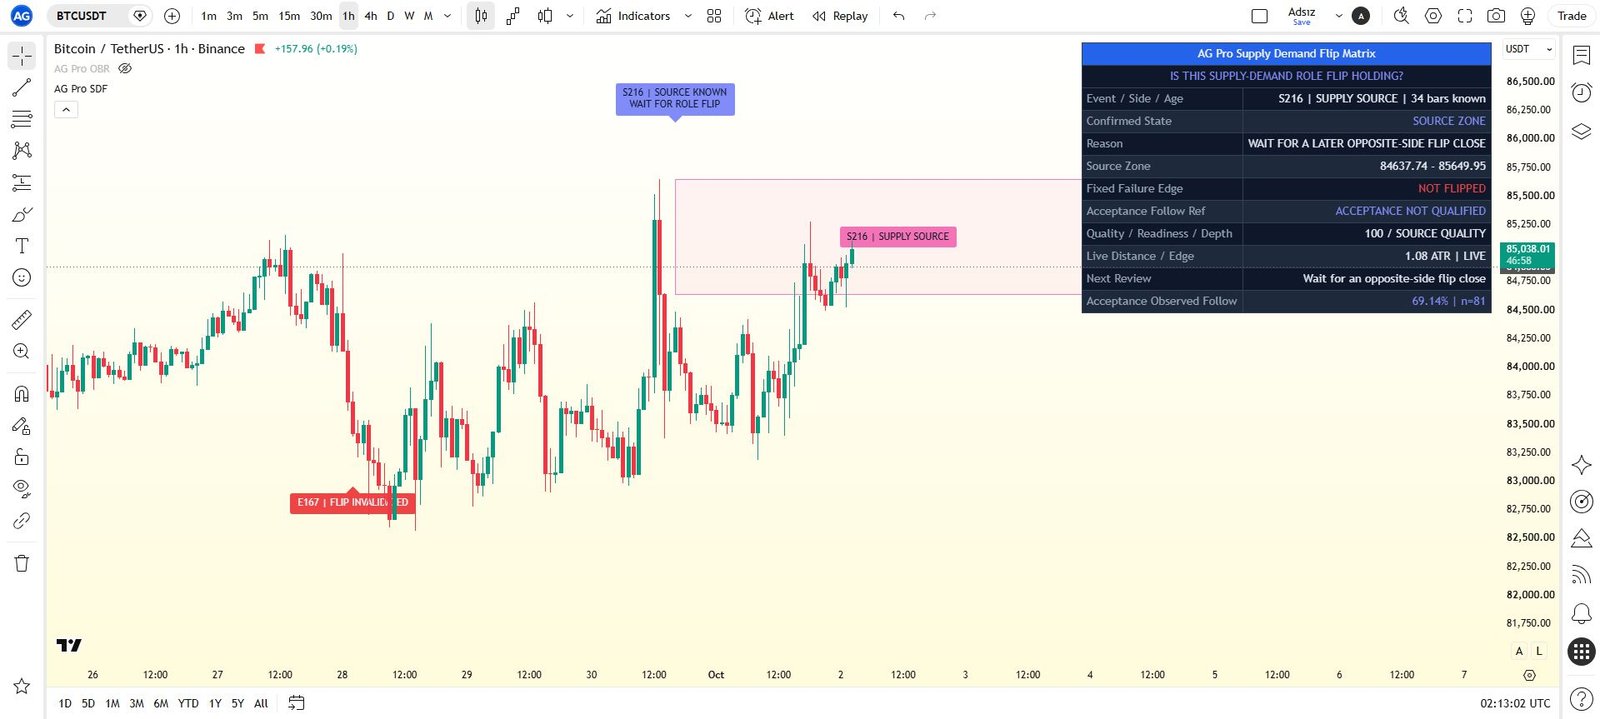
View actual chart & all settings First gallery image: historical TradingView interface. Second image: illustrative cover. Open the gallery to inspect details.
Manual TradingView activation
Submit the exact TradingView username at checkout. Manual review begins after verified payment; access confirmation follows when activation is complete.
One-time payment. No subscription. Available payment methods are shown before order placement.
Need help before purchase? Ask AGProLabs →
Inside Supply Demand Flip Matrix
Follow a supply–demand zone through acceptance, rejection, and role change.
Supply Demand Flip Matrix gives an active supply or demand zone a visible transition workflow. It maps the area, evaluates acceptance and rejection around its boundary, and summarizes whether a flip is developing, accepted, or losing validity. The chart and panel connect role side, zone range, invalidation, flip score, and next-action context. Its appeal is practical organization: a zone can remain useful to review without every touch being treated as the same event or every role change being assumed complete.
Choose with a clear purpose
What this workflow helps you inspect.
For traders examining whether a price-derived supply or demand area is developing a different support or resistance role.
- Distinguish a watched zone from a role change accepted under the configured rules.
- Read rejection pressure beside the developing flip context.
- Keep the mapped zone and its current analytical role connected on the chart.
Read the detailed workflow fit
- For price-action users studying supply–demand retests and role reversals. It is built for reviewing how a zone behaves after its original role starts changing. Clean structure and readable interactions are more useful than a large number of noisy boxes, especially when comparing accepted transitions with rejected or inactive examples.
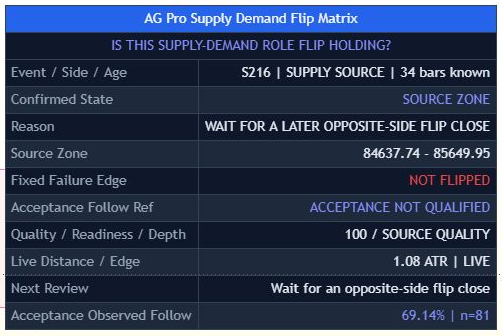 Inspect interface detail
Qualified source-zone mapping
A supply or demand box can become detached from the structure that caused it to matter.
Flip acceptance review
Moving across a zone boundary does not by itself establish that its role has changed.
Rejection and invalidation context
A zone can look visually intact while the attempted flip is being rejected.
See what each layer contributes.
Open a module to explore its purpose, practical interpretation and boundaries. Examples describe a review process; they are not promises of a trading result.
01Qualified source-zone mappingA supply or demand box can become detached from the structure that caused it to matter.
The source qualification uses structure, displacement, wick behavior, and local context. The active zone is projected forward so its subsequent interaction remains visible. This gives the workflow a defined source area and a current reference, rather than relying only on a remembered reaction somewhere in chart history.
A practical reading
Identify the active source zone first, then observe how price behaves when it returns to the boundary.
Keep in view: The zone is a rule-based price-area interpretation; it does not reveal actual hidden orders or participant intent.
02Flip acceptance reviewMoving across a zone boundary does not by itself establish that its role has changed.
Acceptance logic evaluates the behavior around the active boundary as a possible role transition develops. Zone Watch, Acceptance, and Flip Accepted distinguish monitoring from stronger rule-based acceptance. The panel keeps the role and flip state visible so the reader can separate an original supply/demand reference from the role it is currently being evaluated for.
A practical reading
A boundary interaction may remain under watch before the script's acceptance requirements are met.
Keep in view: Flip Accepted is a contextual classification, not proof that price must continue respecting the new role.
03Rejection and invalidation contextA zone can look visually intact while the attempted flip is being rejected.
Rejection pressure provides the opposing side of the review. When behavior weakens the active context, invalidation and inactive-zone states make that deterioration explicit. The workflow therefore gives an unsuccessful transition a readable identity instead of presenting every mapped area as a continuing opportunity.
A practical reading
Price can respond against a developing flip, raising rejection pressure and eventually leaving the zone inactive under the rules.
Keep in view: A warning does not cap an adverse move, and news or thin liquidity can overwhelm an otherwise clear-looking reference.
04Coordinated chart and panel statesSeveral overlapping zone concepts can become difficult to interpret at a glance.
The visual language distinguishes demand-side or accepted behavior, supply-side context, watch states, rejection/invalidation pressure, and acceptance context. Labels and the Current Review summary connect those colors with named workflow states. The panel brings acceptance, rejection, invalidation, flip score, and next action into the same compact review surface.
A practical reading
Read the named state and panel values together before attaching meaning to the zone color alone.
Keep in view: Color and score are presentation tools for the underlying rules, not calibrated probabilities of a future reaction.
Understand the controls before changing them.
Explore the main controls and control groups below. Read the current TradingView Inputs and tooltips for the available values; choose a consistent configuration before reviewing its results.
Reaction Mode
Selects both sides, demand only, or supply only.
When to adjust
To focus on a defined role-transition study.
Watch for
Filtering a side does not make that side more valid.
Lookback
Controls the structure and zone measurement window.
When to adjust
When comparing local and broader source contexts.
Watch for
A new window can change the active reference.
Sensitivity
Sets the strictness of source-zone qualification.
When to adjust
When the study requires different event selectivity.
Watch for
More or fewer zones is not equivalent to better analysis.
Zone Width Model
Changes how wide the active supply/demand area is drawn.
When to adjust
When examining how area geometry affects interaction.
Watch for
A broad area can hide distinctions visible in a narrower review.
Acceptance Strictness
Controls how demanding the flip-acceptance logic is.
When to adjust
To compare the evidence required for acceptance.
Watch for
A stricter classification is not a guarantee of persistence.
Rejection Strictness
Controls how quickly rejection pressure increases.
When to adjust
When testing the responsiveness of opposing-context review.
Watch for
A slower response does not reduce the market's actual risk.
Projection Bars
Sets how far the active zone is projected to the right.
When to adjust
To fit the review horizon and chart layout.
Watch for
A longer drawing is not a longer validity guarantee.
Visual Preset
Adjusts chart annotation density.
When to adjust
When labels compete with the active structure.
Watch for
Use state names and panel context instead of counting labels as evidence.
Complete settings reference
Open complete settings reference
Every setting, explained.
Explore each input, its source default, available choices and practical effect before changing your configuration.
The reference shows defaults in the verified source. A preset or saved chart can retain different input values. Chart captures illustrate the interface and are not a live signal or a performance record.
From first look to a documented observation.
- Identify whether the active reference began as supply or demand and inspect the structure behind its qualification.
- Locate current price relative to the projected zone and the boundary used for transition review.
- Compare acceptance with rejection and invalidation rather than interpreting one favorable component in isolation.
- Record whether the zone is under watch, accepted, rejected, or inactive, then review the broader market context separately.
Answers specific to this workflow.
Is every zone touch treated as a flip?
No. The workflow distinguishes watching, acceptance, rejection, and inactive context. Touching a mapped area is only part of the review.
Can the tool identify real supply and demand orders?
It uses chart-based rules. The source explicitly excludes understanding hidden order flow, external news, macro events, and trader intent.
Can I focus on demand zones or supply zones only?
Yes. Reaction Mode selects both sides, demand only or supply only. This narrows the review to the chosen side without changing what acceptance or rejection means under the model.
Product overview and access scope
Supply Demand Flip Matrix is a structured supply-and-demand role-transition workflow designed to map active zones, flip acceptance, rejection pressure, invalidation, and current flip quality directly on the chart.
5-Year Access only. Manual activation for one TradingView username after verified payment.
Product-specific chart proof
When a supply or demand zone changes role, is the market accepting the flip, rejecting it, or making the zone inactive?
When a supply or demand zone changes role, is the market accepting the flip, rejecting it, or making the zone inactive? Supply Demand Flip Matrix turns that question into a repeatable TradingView review process.

What it organizes
Supply Demand Flip Matrix is a structured supply-and-demand role-transition workflow designed to map active zones, flip acceptance, rejection pressure, invalidation, and current flip quality directly on the chart.
Analytical and educational use only. No auto-trading, broker execution, financial advice or guaranteed outcome.
Complete product intelligence
Understand the workflow before you activate it.
Purpose, methodology, chart language, operating conditions, controls and limitations are presented below so you can evaluate fit before purchase.
System, Purpose & Difference What the workflow exists to solve, what it produces and why its design differs from generic signal tools.
Core Idea
When a supply or demand zone changes role, is the market accepting the flip, rejecting it, or making the zone inactive?
What This Workflow Does
Supply Demand Flip Matrix is a structured supply-and-demand role-transition workflow designed to map active zones, flip acceptance, rejection pressure, invalidation, and current flip quality directly on the chart.
The script focuses on the behavior that happens after a supply or demand zone starts behaving differently from its original role. Instead of only drawing static zones, it organizes the transition process into readable states such as zone watch, flip accepted, rejection, and zone inactive.
It does not attempt to predict price direction, automate decisions, or provide financial advice. Its purpose is to help users read supply-demand context with clearer visual structure and a dedicated workflow panel.
Purpose & Design Philosophy
This script was built for traders who want more than a basic supply and demand box.
Traditional supply-demand tools often mark zones and leave the user to manually decide whether the zone is still valid, accepted, rejected, or structurally inactive. Supply Demand Flip Matrix adds a decision-support layer around that process.
Why It Is Different
Most supply and demand tools focus on drawing zones.
This script does NOT treat every zone touch as the same event.
Instead, it evaluates whether the active zone is still being watched, whether price is accepting the flip, whether rejection pressure is building, whether invalidation has appeared, and whether the current zone context is becoming inactive.
The result is a cleaner workflow for supply-demand role transitions rather than a simple zone marker.
Methodology & Chart Language How context is processed and how zones, labels, colors, panels and visual states should be read.
Methodology
1. Context Detection The script identifies qualified supply or demand source areas using structure, displacement, wick behavior, and local context.
2. Zone Mapping A live zone is projected forward so the user can track whether price is interacting with the active supply-demand reference.
3. Flip Evaluation The script evaluates acceptance and rejection behavior around the zone boundary to determine whether a role transition is building or confirmed.
4. Invalidation Review If price behavior weakens the active zone context, the script raises invalidation or inactive-zone review states.
5. Visual Output Zones, labels, and panel values are organized into a compact workflow so the current state can be interpreted quickly.
How to Read the Chart
Zones represent the active supply or demand area being evaluated.
Labels mark key workflow states such as acceptance, rejection, flip accepted, inactive, or current review.
Colors separate the role and state: • Teal tones highlight constructive demand-side or accepted behavior • Pink tones highlight supply-side or opposing role behavior • Yellow tones highlight watch or review states • Red tones highlight rejection, invalidation, or inactive pressure • Indigo tones highlight acceptance context
The panel summarizes the same workflow in a compact command-center format, including role side, zone range, flip state, acceptance, rejection, invalidation, flip score, and next action.
Signals, States & Alerts What each visible state represents and when an alert marks a condition that deserves attention.
Signals & States
- Zone Watch -> the active zone is being monitored for reaction or transition behavior
- Acceptance -> price behavior is showing acceptance around the zone context
- Flip Accepted -> the zone has begun behaving as a role-transition reference
- Rejection -> price is responding against the attempted flip context
- Zone Inactive -> the active zone context has lost validity under the script rules
- Current Review -> the latest active state summarized near the current chart area
Best Conditions & When to Step Back Where the workflow is most useful, which conditions weaken interpretation and how context changes the reading.
When to Use
This script is best suited for:
- Supply and demand zone review
- Role reversal and flip analysis
- Price action structure review
- Retest and reaction workflows
- Multi-timeframe chart study
- Markets where clean structure and zone behavior are visible
When Not to Use
Avoid relying on this script in isolation during:
- Extremely illiquid markets
- Very noisy low-timeframe conditions
- Major news-driven volatility
- Thin order book environments
- Charts with inconsistent price history
- Situations where broader market context is unclear
The script is strongest when used as part of a structured chart review process.
Controls, Interface & Practical Workflow The main inputs, visual controls and a repeatable sequence for using the workflow without losing chart clarity.
Key Inputs
- Reaction Mode -> controls whether the workflow evaluates both sides, demand only, or supply only • Lookback -> adjusts the structure and zone measurement window • Sensitivity -> controls how strict the source-zone qualification should be • Zone Width Model -> changes how wide the active zone is drawn • Acceptance Strictness -> controls how demanding the flip-acceptance logic is • Rejection Strictness -> controls how quickly rejection pressure increases • Projection Bars -> controls how far the active zone is projected to the right • Visual Preset -> adjusts chart annotation density • Label Font Size -> controls chart-label text size.
Boundaries, Limitations & Risk What the workflow does not do, where its outputs can weaken and the risk boundaries every buyer should understand.
What This Workflow Is Not
This script is not a prediction engine.
It is not an auto-trading system.
It is not financial advice.
It does not guarantee profitable outcomes.
It does not replace personal analysis, risk management, or broader market review.
Limitations & Transparency
Supply-demand behavior can change quickly across different timeframes.
A zone that looks clean on one timeframe may be noisy or less meaningful on another. Volatility, liquidity, spread, and session behavior can also affect how the workflow states appear.
The script uses rule-based logic. It cannot understand external news, macro events, hidden order flow, or trader intent.
Risk Disclosure
Trading and investing involve risk.
All outputs from this script are for educational and analytical purposes only. Users are responsible for their own decisions, risk controls, and interpretation of market conditions.
5-Year Access & Delivery The access term, payment-to-activation sequence and the TradingView username required for manual delivery.
5-Year Access & Delivery
- New-purchase access: At least five years of access — 1,827 days from purchase. One-time payment; no automatic renewal.
- One TradingView username: submit the exact username during checkout.
- Manual activation: invite-only access is enabled after payment confirmation.
This is an analytical and educational TradingView workflow. It does not connect to a broker, place trades, manage an account, provide financial advice, or guarantee results. Trading involves risk, and every decision remains the user's responsibility.
Before you buy
Clear access. Clear purpose. No signal-shop promises.
Supply Demand Flip Matrix is delivered as a TradingView Pine Script workflow for structured analysis and chart review. Access is activated manually for the TradingView username submitted at checkout.
- TradingView accessInvite-only access is enabled after payment confirmation.
- Analysis workflowDesigned for context, structure, risk review and visual discipline.
- Not auto-tradingNo broker connection, no account management and no guaranteed outcome.
Product FAQ
Is this a TradingView Pine Script workflow?
Yes. This product is an invite-only AGPro Series workflow for use inside TradingView.
Does it trade automatically?
No. AGProLabs workflows are analytical tools. They do not connect to brokers, place trades or guarantee outcomes.
How is access activated?
Access is activated manually for the TradingView username submitted during checkout after payment confirmation.
Does access include TradingView or paid market data?
No. This purchase provides invite-only access to the selected AGProLabs workflow. It does not include a TradingView subscription or paid exchange data. Check your TradingView plan, available data, chart resources and alert capabilities for your intended workflow before ordering; contact support if unsure.
Related workflows
-

Order Block Reclaim Matrix [AGPro Series]
Trace a registered order block through mitigation, later reclaim and failure pressure.
AccessSingle workflow 5-Year Access$149.00 View workflow One 5-Year Access option. View details on the product page. -

Sweep Reclaim Decision Matrix [AGPro Series]
Follow a swept level into later reclaim, retest or failure context.
AccessSingle workflow 5-Year Access$149.00 View workflow One 5-Year Access option. View details on the product page. -

Liquidity Command Center Elite [AGPro Series]
Map nearby liquidity pools and separate pool proximity from a confirmed sweep.
AccessSingle workflow 5-Year Access$149.00 View workflow One 5-Year Access option. View details on the product page.
Compare other premium products (40)
Open a product to review its methodology, interface and access details.
Confirmation & Playbook
- Adaptive Market Playbook [AGPro Series]
- CME Gap Magnet [AGPro Series]
- Confluence Alert Engine [AGPro Series]
- Crypto Rotation Opportunity Matrix [AGPro Series]
- Crypto Setup Planner [AGPro Series]
- Divergence Reversal Decision Matrix [AGPro Series]
- Dynamic Channels Elite [AGPro Series]
- Edge Confidence Gauge [AGPro Series]
- Edge Consistency Gauge [AGPro Series]
- Expected Move Cone [AGPro Series]
- Market Confirmation Engine [AGPro Series]
- Market Tradability Gate [AGPro Series]
- Rejection Block Execution Planner [AGPro Series]
- Seasonal Edge Clock [AGPro Series]
- Support Resistance Continuation Matrix [AGPro Series]
- Trade Edge Profiler [AGPro Series]
- VWAP Acceptance Execution Matrix [AGPro Series]
Defense & Management
Liquidity & Reclaim
Platform Access
Risk & Execution
- Position Scaling Engine [AGPro Series]
- R-Expectancy Surface [AGPro Series]
- Risk of Ruin Engine [AGPro Series]
- Risk Reward Execution Matrix [AGPro Series]
- Target Ladder Confluence Planner [AGPro Series]
- Trade Excursion Engine [AGPro Series]
- Trade Management Planner Elite [AGPro Series]
- Trade Outcome Simulator [AGPro Series]
SMC & Structure
- Auto Fib Structure Planner [AGPro Series]
- Breaker Block Transition Planner [AGPro Series]
- Harmonic Completion Engine [AGPro Series]
- Institutional Reaction Planner Elite [AGPro Series]
- Structure Failure Recovery Matrix [AGPro Series]
- Trade Conviction Engine [AGPro Series]
- Trendline Retest Execution Matrix [AGPro Series]