Use your browser’s Find (Ctrl+F / ⌘F) to locate a setting. Open its row for the full explanation and limits. Source-check time is a verification timestamp, not a script publication date.
Edge Source
3 inputsWin-rate source
- Input type
string- Source default
"Measured"- Available options
["Measured", "Manual"]- Minimum
Not specified in source- Maximum
Not specified in source- Step
Not specified in source
What it controls
Measured: win rate is read from a built-in trigger + proof engine.
Effect on the script
Manual: you enter the win rate yourself.
When to adjust it
Use the source that matches the question being studied and keep its origin clear when comparing outputs.
Interpretation and limits
A built-in proxy is not a personal account record. Manual assumptions are not automatically verified by the script.
Original input tooltip
Measured: win rate is read from a built-in trigger + proof engine. Manual: you enter the win rate yourself.
Manual win rate (%)
- Input type
float- Source default
45.0- Available options
Not specified in source- Minimum
1- Maximum
99- Step
0.5
What it controls
Assumed win probability in Manual mode; not measured evidence.
Effect on the script
Supplies the win-probability assumption used by Manual mode rather than measured chart observations.
When to adjust it
Update it when the independently documented scenario or evidence supporting the manual assumption changes.
Interpretation and limits
Assumed win probability in Manual mode; not measured evidence.
Original input tooltip
Assumed win probability in Manual mode; not measured evidence.
Payoff R (reward : risk)
- Input type
float- Source default
2.0- Available options
Not specified in source- Minimum
0.1- Maximum
10- Step
0.1
What it controls
Reward-to-risk of the trade.
Effect on the script
In Measured mode this is also the target distance (in R) the engine tests for.
When to adjust it
Change it only when the specific analytical or presentation question in the tooltip changes.
Interpretation and limits
Record the configuration when comparing observations; a changed setting is not proof of a stronger future result.
Original input tooltip
Reward-to-risk of the trade. In Measured mode this is also the target distance (in R) the engine tests for.
Measured Engine
5 inputsTrigger EMA length
- Input type
int- Source default
50- Available options
Not specified in source- Minimum
2- Maximum
Not specified in source- Step
Not specified in source
What it controls
A transparent proxy entry: long when price crosses above this EMA, short when it crosses below.
Effect on the script
A stand-in for your own entry.
When to adjust it
Change it when comparing a different analytical horizon and record the configuration alongside the observations.
Interpretation and limits
Different windows produce different contexts and are not evidence of an improved future result.
Original input tooltip
A transparent proxy entry: long when price crosses above this EMA, short when it crosses below. A stand-in for your own entry.
ATR length (risk unit)
- Input type
int- Source default
14- Available options
Not specified in source- Minimum
1- Maximum
Not specified in source- Step
Not specified in source
What it controls
ATR window for the fixed initial risk unit.
Effect on the script
The measured engine waits for this window and the EMA warmup.
When to adjust it
Adjust it only when deliberately comparing a different volatility baseline.
Interpretation and limits
A different ATR unit changes the reference context; it does not make adverse price movement safely bounded.
Original input tooltip
ATR window for the fixed initial risk unit. The measured engine waits for this window and the EMA warmup.
Max bars in trade
- Input type
int- Source default
60- Available options
Not specified in source- Minimum
5- Maximum
Not specified in source- Step
Not specified in source
What it controls
If neither target nor stop is reached within this many bars, the observation expires.
Effect on the script
Expired observations are excluded from win-rate scoring and reported in the panel audit.
When to adjust it
Change it when studying another explicitly defined event or observation horizon.
Interpretation and limits
Expired observations are excluded from win-rate scoring and reported in the panel audit.
Original input tooltip
If neither target nor stop is reached within this many bars, the observation expires. Expired observations are excluded from win-rate scoring and reported in the panel audit.
Min samples before scoring
- Input type
int- Source default
6- Available options
Not specified in source- Minimum
2- Maximum
Not specified in source- Step
Not specified in source
What it controls
Minimum resolved wins plus losses before measured scoring and current-cell highlighting.
Effect on the script
Sets the documented resolved-sample requirement before the affected score, reference, or verdict is eligible.
When to adjust it
Use it to specify the minimum amount of eligible evidence required for the review.
Interpretation and limits
Passing a sample threshold is a display/model condition, not independent validation of a future edge.
Original input tooltip
Minimum resolved wins plus losses before measured scoring and current-cell highlighting.
Same-bar target & stop
- Input type
string- Source default
"Exclude"- Available options
["Exclude", "Stop First", "Target First"]- Minimum
Not specified in source- Maximum
Not specified in source- Step
Not specified in source
What it controls
If the opening price is at or beyond an edge it is evaluated first.
Effect on the script
Otherwise OHLC cannot reveal event order when both edges are touched: Exclude leaves it unscored; Stop First and Target First assign an explicit assumption. Outcomes remain fixed-payoff classifications, not actual fills.
When to adjust it
Use it for a stated ambiguity-policy comparison while keeping all other observation settings fixed.
Interpretation and limits
Outcomes remain fixed-payoff classifications, not actual fills.
Original input tooltip
If the opening price is at or beyond an edge it is evaluated first. Otherwise OHLC cannot reveal event order when both edges are touched: Exclude leaves it unscored; Stop First and Target First assign an explicit assumption. Outcomes remain fixed-payoff classifications, not actual fills.
Sensitivity
5 inputsWin-rate step (for lever test)
- Input type
float- Source default
0.05- Available options
Not specified in source- Minimum
0.005- Maximum
1.0- Step
0.005
What it controls
Hypothetical win-rate increment (0.05 = 5 percentage points).
Effect on the script
Changes the hypothetical win-rate increment in the lever comparison; the increment is clipped to the remaining distance to 100%.
When to adjust it
Change it only when the specific analytical or presentation question in the tooltip changes.
Interpretation and limits
The comparison clips at 100%; it does not measure the practical ease of improving win rate.
Original input tooltip
Hypothetical win-rate increment (0.05 = 5 percentage points). The comparison clips at 100%; it does not measure the practical ease of improving win rate.
Payoff-R step (for lever test)
- Input type
float- Source default
0.25- Available options
Not specified in source- Minimum
0.05- Maximum
10.0- Step
0.05
What it controls
Hypothetical payoff increment, clipped at the supported 10R maximum.
Effect on the script
Changes the hypothetical payoff increment in the lever comparison; the comparison is clipped at the supported 10R setup maximum.
When to adjust it
Change it only when the specific analytical or presentation question in the tooltip changes.
Interpretation and limits
Record the configuration when comparing observations; a changed setting is not proof of a stronger future result.
Original input tooltip
Hypothetical payoff increment, clipped at the supported 10R maximum. Win rate is held fixed for this scenario.
Target expectancy (R/trade)
- Input type
float- Source default
0.3- Available options
Not specified in source- Minimum
Not specified in source- Maximum
Not specified in source- Step
0.05
What it controls
Target gross expectancy for separate win-rate-only and payoff-only scenarios.
Effect on the script
Sets the gross-expectancy target used to calculate the gap from current model expectancy and compare separate improvement scenarios.
When to adjust it
Change it only when the specific analytical or presentation question in the tooltip changes.
Interpretation and limits
Record the configuration when comparing observations; a changed setting is not proof of a stronger future result.
Original input tooltip
Target gross expectancy for separate win-rate-only and payoff-only scenarios. A scenario can be outside the supported model range.
Headroom scale (R)
- Input type
float- Source default
0.5- Available options
Not specified in source- Minimum
0.1- Maximum
Not specified in source- Step
0.05
What it controls
Expectancy that maps to full headroom.
Effect on the script
Scales gross expectancy into the bounded headroom diagnostic around 50; it does not change the underlying expectancy.
When to adjust it
Change it only when the specific analytical or presentation question in the tooltip changes.
Interpretation and limits
This is not a probability or confidence score.
Original input tooltip
Expectancy that maps to full headroom. Larger values move the diagnostic closer to 50. This is not a probability or confidence score.
Breakeven dead-band (R)
- Input type
float- Source default
0.02- Available options
Not specified in source- Minimum
0- Maximum
Not specified in source- Step
0.01
What it controls
Absolute gross expectancy tolerance around zero used for the neutral state and surface band.
Effect on the script
Applies this parameter to the component and behavior stated in its source tooltip.
When to adjust it
Change it only when the specific analytical or presentation question in the tooltip changes.
Interpretation and limits
Record the configuration when comparing observations; a changed setting is not proof of a stronger future result.
Original input tooltip
Absolute gross expectancy tolerance around zero used for the neutral state and surface band.
Heat Surface
8 inputsSurface font size
- Input type
string- Source default
"Normal"- Available options
["Tiny", "Small", "Normal", "Large"]- Minimum
Not specified in source- Maximum
Not specified in source- Step
Not specified in source
What it controls
Independent surface text size.
Effect on the script
Normal is the default; the compact grid limits width without shrinking text.
When to adjust it
Adjust it for the chart size and viewing distance while preserving readable boundaries and state information.
Interpretation and limits
A larger font can increase chart overlap. Text size does not change the analytical observations.
Original input tooltip
Independent surface text size. Normal is the default; the compact grid limits width without shrinking text.
Surface layout
- Input type
string- Source default
"Compact"- Available options
["Compact", "Detailed"]- Minimum
Not specified in source- Maximum
Not specified in source- Step
Not specified in source
What it controls
Compact shows 5 win-rate columns by 5 payoff rows.
Effect on the script
Detailed retains the original 9 by 7 surface.
When to adjust it
Use the current-state view for orientation and the available evidence/audit view when checking observation provenance and exclusions.
Interpretation and limits
A compact or hidden view does not remove the limitations of the underlying observations.
Original input tooltip
Compact shows 5 win-rate columns by 5 payoff rows. Detailed retains the original 9 by 7 surface.
Show expectancy surface
- Input type
bool- Source default
true- Available options
Not specified in source- Minimum
Not specified in source- Maximum
Not specified in source- Step
Not specified in source
What it controls
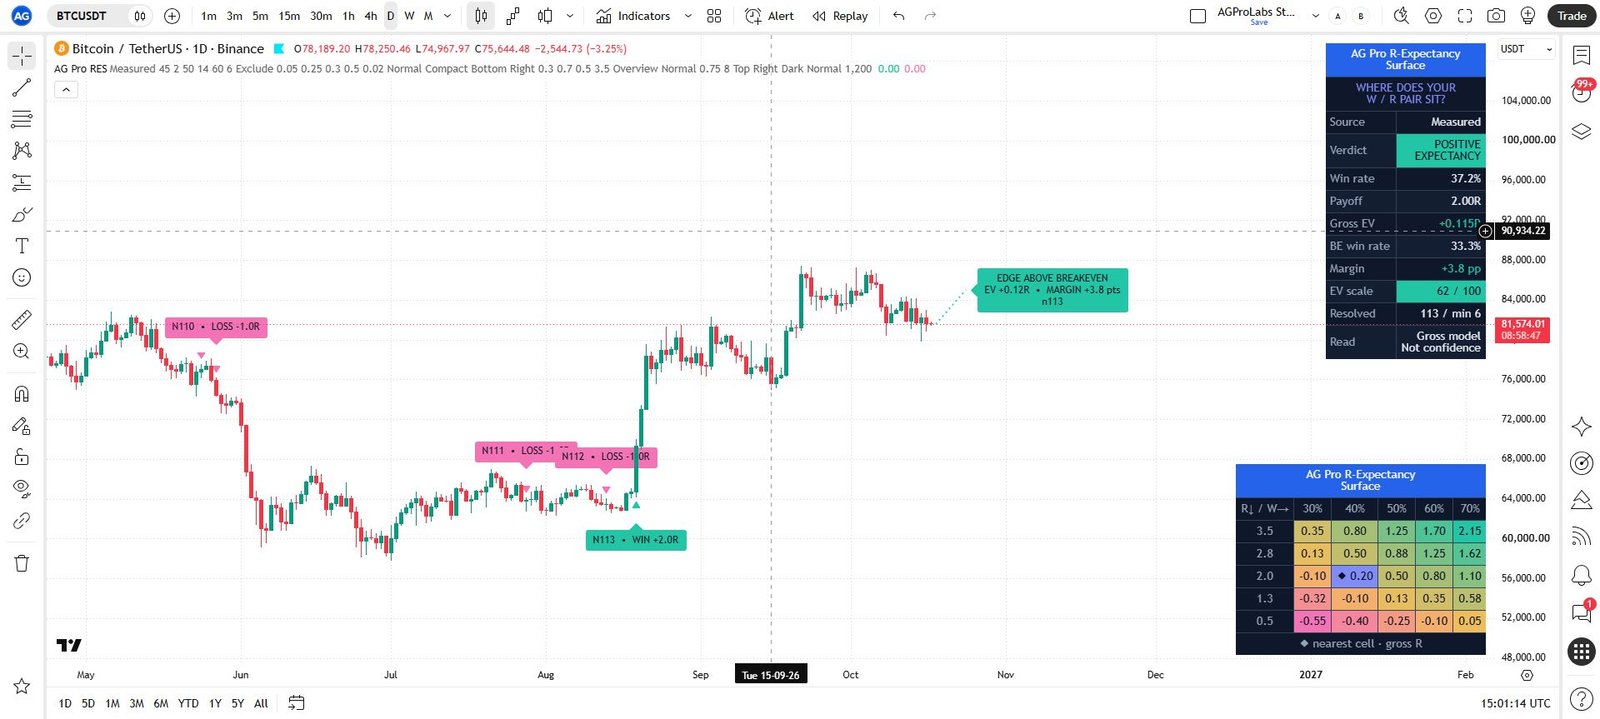
Shows the win-rate by payoff expectancy surface.
Effect on the script
Selects which already calculated information is presented in the visible panel or summary view.
When to adjust it
Use the current-state view for orientation and the available evidence/audit view when checking observation provenance and exclusions.
Interpretation and limits
A compact or hidden view does not remove the limitations of the underlying observations.
Original input tooltip
Shows the win-rate by payoff expectancy surface.
Surface position
- Input type
string- Source default
"Bottom Right"- Available options
["Top Right", "Top Left", "Top Center", "Middle Right", "Middle Left", "Bottom Right", "Bottom Left", "Bottom Center"]- Minimum
Not specified in source- Maximum
Not specified in source- Step
Not specified in source
What it controls
Surface location.
Effect on the script
If it matches the visible decision panel, the surface is moved to the opposite vertical position.
When to adjust it
Change it only when the specific analytical or presentation question in the tooltip changes.
Interpretation and limits
Record the configuration when comparing observations; a changed setting is not proof of a stronger future result.
Original input tooltip
Surface location. If it matches the visible decision panel, the surface is moved to the opposite vertical position.
Win-rate min
- Input type
float- Source default
0.3- Available options
Not specified in source- Minimum
0.05- Maximum
0.95- Step
0.05
What it controls
First win-rate endpoint as a fraction.
Effect on the script
Endpoints are sorted automatically.
When to adjust it
Change it only when the specific analytical or presentation question in the tooltip changes.
Interpretation and limits
Record the configuration when comparing observations; a changed setting is not proof of a stronger future result.
Original input tooltip
First win-rate endpoint as a fraction. Endpoints are sorted automatically.
Win-rate max
- Input type
float- Source default
0.7- Available options
Not specified in source- Minimum
0.1- Maximum
0.98- Step
0.05
What it controls
Second win-rate endpoint as a fraction.
Effect on the script
Equal endpoints create a single-value axis.
When to adjust it
Change it only when the specific analytical or presentation question in the tooltip changes.
Interpretation and limits
Record the configuration when comparing observations; a changed setting is not proof of a stronger future result.
Original input tooltip
Second win-rate endpoint as a fraction. Equal endpoints create a single-value axis.
Payoff-R min
- Input type
float- Source default
0.5- Available options
Not specified in source- Minimum
0.1- Maximum
Not specified in source- Step
0.1
What it controls
First gross payoff endpoint.
Effect on the script
Endpoints are sorted automatically.
When to adjust it
Change it only when the specific analytical or presentation question in the tooltip changes.
Interpretation and limits
Record the configuration when comparing observations; a changed setting is not proof of a stronger future result.
Original input tooltip
First gross payoff endpoint. Endpoints are sorted automatically.
Payoff-R max
- Input type
float- Source default
3.5- Available options
Not specified in source- Minimum
0.2- Maximum
Not specified in source- Step
0.1
What it controls
Second gross payoff endpoint.
Effect on the script
The surface may illustrate payoffs beyond the active setup input limit.
When to adjust it
Change it only when the specific analytical or presentation question in the tooltip changes.
Interpretation and limits
Record the configuration when comparing observations; a changed setting is not proof of a stronger future result.
Original input tooltip
Second gross payoff endpoint. The surface may illustrate payoffs beyond the active setup input limit.
Decision Panel
11 inputsPanel page
- Input type
string- Source default
"Overview"- Available options
["Overview", "Sensitivity", "Audit"]- Minimum
Not specified in source- Maximum
Not specified in source- Step
Not specified in source
What it controls
Overview summarizes the gross expectancy pair.
Effect on the script
Sensitivity compares bounded assumptions. Audit exposes the measured observation ledger.
When to adjust it
Use the current-state view for orientation and the available evidence/audit view when checking observation provenance and exclusions.
Interpretation and limits
Sensitivity compares bounded assumptions.
Original input tooltip
Overview summarizes the gross expectancy pair. Sensitivity compares bounded assumptions. Audit exposes the measured observation ledger.
Label font size
- Input type
string- Source default
"Normal"- Available options
["Tiny", "Small", "Normal", "Large"]- Minimum
Not specified in source- Maximum
Not specified in source- Step
Not specified in source
What it controls
Font size for the edge badge and all four historical outcome labels.
Effect on the script
Controls the text-size mapping used by the relevant panel or chart-label renderer.
When to adjust it
Adjust it for the chart size and viewing distance while preserving readable boundaries and state information.
Interpretation and limits
A larger font can increase chart overlap. Text size does not change the analytical observations.
Original input tooltip
Font size for the edge badge and all four historical outcome labels.
Outcome label gap (ATR)
- Input type
float- Source default
0.75- Available options
Not specified in source- Minimum
0.25- Maximum
3.0- Step
0.25
What it controls
Distance beyond the recent five-bar high or low at resolution.
Effect on the script
Only nearby outcome labels are staggered; spacing in pixels depends on chart zoom.
When to adjust it
Change it only when the specific analytical or presentation question in the tooltip changes.
Interpretation and limits
Record the configuration when comparing observations; a changed setting is not proof of a stronger future result.
Original input tooltip
Distance beyond the recent five-bar high or low at resolution. Only nearby outcome labels are staggered; spacing in pixels depends on chart zoom.
Edge badge offset (bars)
- Input type
int- Source default
8- Available options
Not specified in source- Minimum
2- Maximum
40- Step
Not specified in source
What it controls
Places the left-anchored active badge to the right of the last candle.
Effect on the script
Controls the horizontal extent or placement of the relevant chart drawing in bars.
When to adjust it
Adjust it when the available forward chart space or the intended visual review area changes.
Interpretation and limits
Drawing farther to the right does not extend event validity or establish that price will reach a reference.
Original input tooltip
Places the left-anchored active badge to the right of the last candle.
Show panel
- Input type
bool- Source default
true- Available options
Not specified in source- Minimum
Not specified in source- Maximum
Not specified in source- Step
Not specified in source
What it controls
Shows the compact decision panel.
Effect on the script
Controls whether the workflow table is rendered on the chart.
When to adjust it
Show the panel to inspect the state and evidence, or hide it when chart space is the immediate priority.
Interpretation and limits
Hiding the panel is a presentation choice; do not treat missing rows as missing risk.
Original input tooltip
Shows the compact decision panel.
Panel position
- Input type
string- Source default
"Top Right"- Available options
["Top Right", "Top Left", "Top Center", "Middle Right", "Middle Left", "Bottom Right", "Bottom Left", "Bottom Center"]- Minimum
Not specified in source- Maximum
Not specified in source- Step
Not specified in source
What it controls
Decision panel location.
Effect on the script
Selects the table position used by the panel renderer.
When to adjust it
Move the panel when it overlaps active candles, the current workflow zone, or reference labels.
Interpretation and limits
Panel placement changes presentation, not the detected context or observation accounting.
Original input tooltip
Decision panel location.
Theme
- Input type
string- Source default
"Dark"- Available options
["Dark", "Light"]- Minimum
Not specified in source- Maximum
Not specified in source- Step
Not specified in source
What it controls
Panel and surface contrast theme.
Effect on the script
Selects the panel background, border, and text color scheme used for contrast.
When to adjust it
Choose the available theme that keeps the panel readable against the chart background.
Interpretation and limits
A theme changes appearance; it does not change event qualification or statistical evidence.
Original input tooltip
Panel and surface contrast theme.
Font size
- Input type
string- Source default
"Normal"- Available options
["Tiny", "Small", "Normal", "Large"]- Minimum
Not specified in source- Maximum
Not specified in source- Step
Not specified in source
What it controls
Decision-panel font size.
Effect on the script
Normal is the default.
When to adjust it
Adjust it for the chart size and viewing distance while preserving readable boundaries and state information.
Interpretation and limits
A larger font can increase chart overlap. Text size does not change the analytical observations.
Original input tooltip
Decision-panel font size. Normal is the default.
Show edge verdict label
- Input type
bool- Source default
true- Available options
Not specified in source- Minimum
Not specified in source- Maximum
Not specified in source- Step
Not specified in source
What it controls
Shows the current expectancy state, expected R per trade and edge margin beside the latest bar.
Effect on the script
Controls visibility of the chart element named by this setting.
When to adjust it
Toggle it to inspect that element or make space for the current chart review.
Interpretation and limits
A visibility switch does not turn a visual reference into an executed order or validated result.
Original input tooltip
Shows the current expectancy state, expected R per trade and edge margin beside the latest bar.
Show recent proof outcomes
- Input type
bool- Source default
true- Available options
Not specified in source- Minimum
Not specified in source- Maximum
Not specified in source- Step
Not specified in source
What it controls
Shows the latest four resolved proof-engine outcomes at their actual resolution bars.
Effect on the script
Controls visibility of the chart element named by this setting.
When to adjust it
Toggle it to inspect that element or make space for the current chart review.
Interpretation and limits
A visibility switch does not turn a visual reference into an executed order or validated result.
Original input tooltip
Shows the latest four resolved proof-engine outcomes at their actual resolution bars.
Win / loss marker history
- Input type
int- Source default
1200- Available options
Not specified in source- Minimum
100- Maximum
5000- Step
Not specified in source
What it controls
Limits measured win/loss triangles to recent chart history while the latest four proof outcomes remain available as auditable labels.
Effect on the script
Applies this parameter to the component and behavior stated in its source tooltip.
When to adjust it
Change it only when the specific analytical or presentation question in the tooltip changes.
Interpretation and limits
Record the configuration when comparing observations; a changed setting is not proof of a stronger future result.
Original input tooltip
Limits measured win/loss triangles to recent chart history while the latest four proof outcomes remain available as auditable labels.
Keep the settings in context
Change one analytical assumption at a time and compare the same instrument, timeframe and history. A chart reference, score, observation rate or input default does not establish a trade fill, a forward probability or a guaranteed outcome.
Return to the product overview · View this script on TradingView