Use your browser’s Find (Ctrl+F / ⌘F) to locate a setting. Open its row for the full explanation and limits. Source-check time is a verification timestamp, not a script publication date.
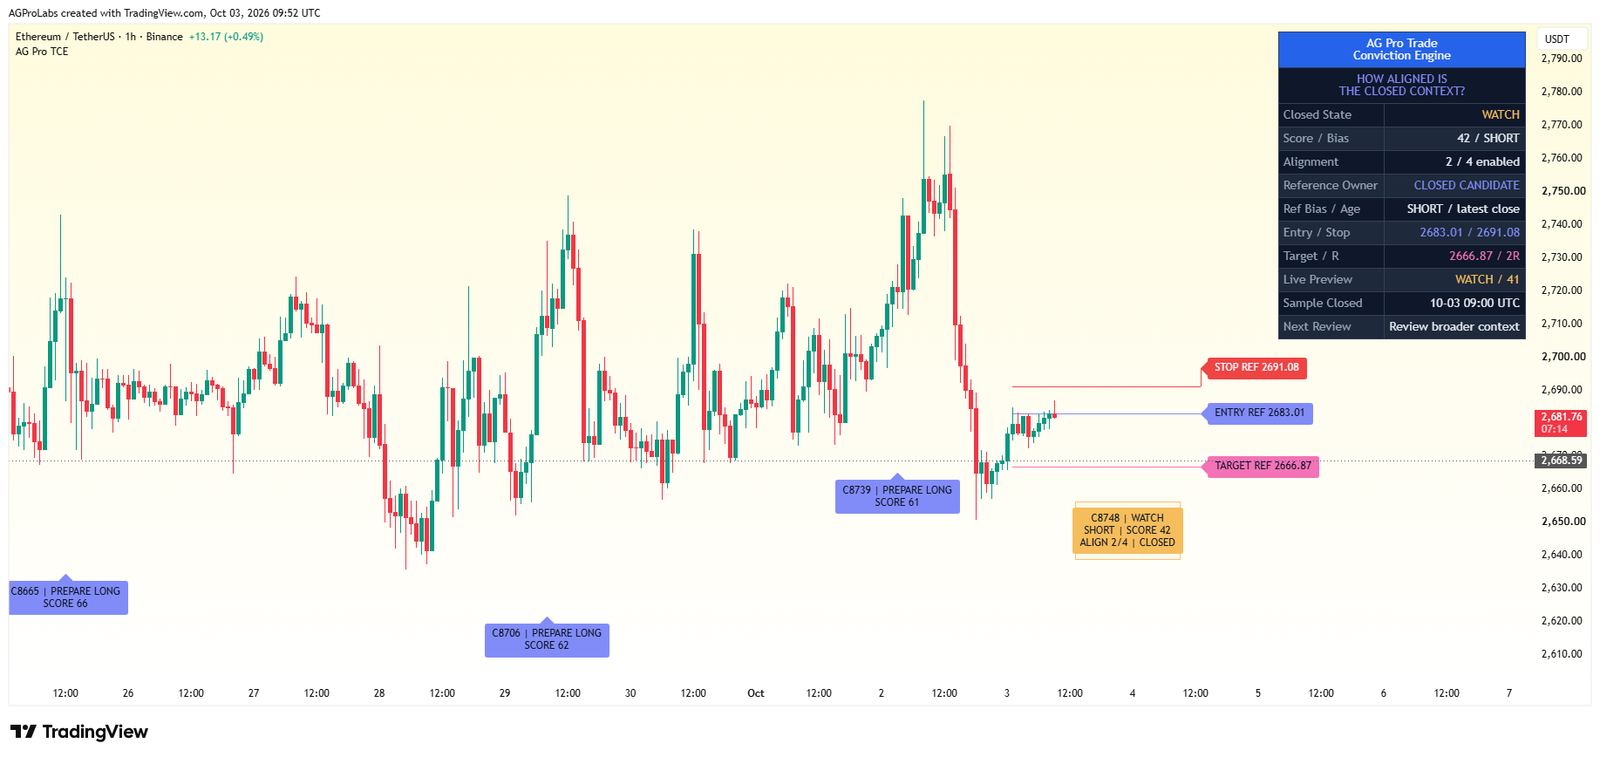
General & Display
7 inputsShow Panel
- Input type
bool- Source default
true- Available options
Not specified in source- Minimum
Not specified in source- Maximum
Not specified in source- Step
Not specified in source
What it controls
Toggle the on-chart conviction dashboard. Enabled by default.
Effect on the script
This controls the visibility, placement, extent or retained history of the documented visual element. It is part of the chart presentation layer.
When to adjust it
Change it when the active reference is hard to inspect or when historical annotations compete with current price action.
Interpretation and limits
Reducing visible history or hiding an element does not improve the underlying observations. A visual projection is not a price forecast.
Original input tooltip
Toggle the on-chart conviction dashboard. Enabled by default.
Panel Theme
- Input type
string- Source default
"Dark"- Available options
["Dark", "Light"]- Minimum
Not specified in source- Maximum
Not specified in source- Step
Not specified in source
What it controls
Visual theme for the panel background and text.
Effect on the script
This changes presentation and legibility of the relevant chart element, rather than the underlying analytical model.
When to adjust it
Change it when the chart background, screen size or other overlays make the current presentation difficult to read.
Interpretation and limits
A visual preference does not strengthen the measured setup or alter its uncertainty.
Original input tooltip
Visual theme for the panel background and text.
Panel Location
- Input type
string- Source default
"Top Right"- Available options
["Top Right", "Top Left", "Bottom Right", "Bottom Left", "Middle Right"]- Minimum
Not specified in source- Maximum
Not specified in source- Step
Not specified in source
What it controls
Position of the compact two-column panel on the chart.
Effect on the script
This changes presentation and legibility of the relevant chart element, rather than the underlying analytical model.
When to adjust it
Change it when the chart background, screen size or other overlays make the current presentation difficult to read.
Interpretation and limits
A visual preference does not strengthen the measured setup or alter its uncertainty.
Original input tooltip
Position of the compact two-column panel on the chart.
Panel Font Size
- Input type
string- Source default
"Normal"- Available options
["Small", "Normal", "Large"]- Minimum
Not specified in source- Maximum
Not specified in source- Step
Not specified in source
What it controls
Readable badge or panel size. Normal is the default; compact pages and wrapping preserve chart space.
Effect on the script
This changes presentation and legibility of the relevant chart element, rather than the underlying analytical model.
When to adjust it
Change it when the chart background, screen size or other overlays make the current presentation difficult to read.
Interpretation and limits
A visual preference does not strengthen the measured setup or alter its uncertainty.
Original input tooltip
Readable badge or panel size. Normal is the default; compact pages and wrapping preserve chart space.
Label Font Size
- Input type
string- Source default
"Normal"- Available options
["Small", "Normal", "Large"]- Minimum
Not specified in source- Maximum
Not specified in source- Step
Not specified in source
What it controls
Readable badge or panel size. Normal is the default; compact pages and wrapping preserve chart space.
Effect on the script
This changes presentation and legibility of the relevant chart element, rather than the underlying analytical model.
When to adjust it
Change it when the chart background, screen size or other overlays make the current presentation difficult to read.
Interpretation and limits
A visual preference does not strengthen the measured setup or alter its uncertainty.
Original input tooltip
Readable badge or panel size. Normal is the default; compact pages and wrapping preserve chart space.
Show Entry / Stop / Target Levels
- Input type
bool- Source default
true- Available options
Not specified in source- Minimum
Not specified in source- Maximum
Not specified in source- Step
Not specified in source
What it controls
Show frozen references while a Ready observation is open. Otherwise show the latest closed-candle candidate references. These are analytical levels, not orders or fills.
Effect on the script
This controls the visibility, placement, extent or retained history of the documented visual element. It is part of the chart presentation layer.
When to adjust it
Change it when the active reference is hard to inspect or when historical annotations compete with current price action.
Interpretation and limits
Reducing visible history or hiding an element does not improve the underlying observations. A visual projection is not a price forecast.
Original input tooltip
Show frozen references while a Ready observation is open. Otherwise show the latest closed-candle candidate references. These are analytical levels, not orders or fills.
Panel Page
- Input type
string- Source default
"Overview"- Available options
["Overview", "Modules", "Evidence"]- Minimum
Not specified in source- Maximum
Not specified in source- Step
Not specified in source
What it controls
Overview separates closed conviction from live preview. Modules explains enabled scores. Evidence reports single-observation OHLC reference touches and exclusions, not executed trades.
Effect on the script
This selects which part of the existing analytical readout is visible in the dashboard. It does not create a different event engine.
When to adjust it
Use a compact or overview page for routine reading and the detailed pages when inspecting assumptions, observations or exclusions.
Interpretation and limits
Information hidden by a page choice can still matter. Check the evidence and model assumptions before relying on a headline score.
Original input tooltip
Overview separates closed conviction from live preview. Modules explains enabled scores. Evidence reports single-observation OHLC reference touches and exclusions, not executed trades.
Observation Evidence
1 inputObservation Horizon (bars)
- Input type
int- Source default
160- Available options
Not specified in source- Minimum
5- Maximum
2000- Step
Not specified in source
What it controls
A qualified Ready observation starts at a confirmed close. Only later closed bars may resolve it. Both-touch bars are ambiguous; untouched observations expire at this horizon. No fills, costs or orders are modeled.
Effect on the script
This sets the documented age, waiting period or forward observation deadline used by the event lifecycle.
When to adjust it
Match the review horizon to the question being studied and keep the deadline explicit in historical comparisons.
Interpretation and limits
Changing a deadline changes which observations resolve, expire or remain eligible. A timed model observation is not a broker trade.
Original input tooltip
A qualified Ready observation starts at a confirmed close. Only later closed bars may resolve it. Both-touch bars are ambiguous; untouched observations expire at this horizon. No fills, costs or orders are modeled.
Module Weights
6 inputsTrend Weight
- Input type
float- Source default
1.0- Available options
Not specified in source- Minimum
0.0- Maximum
5.0- Step
0.5
What it controls
Relative weight of the trend module in the blended score.
Effect on the script
This changes the relative contribution of the named module to the blended score and, where directional, its enabled alignment contribution.
When to adjust it
Change it when defining a documented module-priority scheme rather than fitting the present chart.
Interpretation and limits
Reweighting changes the model. It does not make a preferred direction more likely or turn the score into a probability.
Original input tooltip
Relative weight of the trend module in the blended score.
Momentum Weight
- Input type
float- Source default
1.0- Available options
Not specified in source- Minimum
0.0- Maximum
5.0- Step
0.5
What it controls
Relative contribution of this module. Zero disables its score and directional alignment; enabled directional modules must retain a positive total weight.
Effect on the script
This changes the relative contribution of the named module to the blended score and, where directional, its enabled alignment contribution.
When to adjust it
Change it when defining a documented module-priority scheme rather than fitting the present chart.
Interpretation and limits
Reweighting changes the model. It does not make a preferred direction more likely or turn the score into a probability.
Original input tooltip
Relative contribution of this module. Zero disables its score and directional alignment; enabled directional modules must retain a positive total weight.
Structure Weight
- Input type
float- Source default
1.0- Available options
Not specified in source- Minimum
0.0- Maximum
5.0- Step
0.5
What it controls
Relative contribution of this module. Zero disables its score and directional alignment; enabled directional modules must retain a positive total weight.
Effect on the script
This changes the relative contribution of the named module to the blended score and, where directional, its enabled alignment contribution.
When to adjust it
Change it when defining a documented module-priority scheme rather than fitting the present chart.
Interpretation and limits
Reweighting changes the model. It does not make a preferred direction more likely or turn the score into a probability.
Original input tooltip
Relative contribution of this module. Zero disables its score and directional alignment; enabled directional modules must retain a positive total weight.
Volatility Weight
- Input type
float- Source default
1.0- Available options
Not specified in source- Minimum
0.0- Maximum
5.0- Step
0.5
What it controls
Relative contribution of this module. Zero disables its score and directional alignment; enabled directional modules must retain a positive total weight.
Effect on the script
This changes the relative contribution of the named module to the blended score and, where directional, its enabled alignment contribution.
When to adjust it
Change it when defining a documented module-priority scheme rather than fitting the present chart.
Interpretation and limits
Reweighting changes the model. It does not make a preferred direction more likely or turn the score into a probability.
Original input tooltip
Relative contribution of this module. Zero disables its score and directional alignment; enabled directional modules must retain a positive total weight.
Volume Weight
- Input type
float- Source default
1.0- Available options
Not specified in source- Minimum
0.0- Maximum
5.0- Step
0.5
What it controls
Relative contribution of this module. Zero disables its score and directional alignment; enabled directional modules must retain a positive total weight.
Effect on the script
This changes the relative contribution of the named module to the blended score and, where directional, its enabled alignment contribution.
When to adjust it
Change it when defining a documented module-priority scheme rather than fitting the present chart.
Interpretation and limits
Reweighting changes the model. It does not make a preferred direction more likely or turn the score into a probability.
Original input tooltip
Relative contribution of this module. Zero disables its score and directional alignment; enabled directional modules must retain a positive total weight.
Risk Location Weight
- Input type
float- Source default
1.0- Available options
Not specified in source- Minimum
0.0- Maximum
5.0- Step
0.5
What it controls
Relative contribution of this module. Zero disables its score and directional alignment; enabled directional modules must retain a positive total weight.
Effect on the script
This changes the relative contribution of the named module to the blended score and, where directional, its enabled alignment contribution.
When to adjust it
Change it when defining a documented module-priority scheme rather than fitting the present chart.
Interpretation and limits
Reweighting changes the model. It does not make a preferred direction more likely or turn the score into a probability.
Original input tooltip
Relative contribution of this module. Zero disables its score and directional alignment; enabled directional modules must retain a positive total weight.
Trend Module
3 inputsFast EMA Length
- Input type
int- Source default
20- Available options
Not specified in source- Minimum
2- Maximum
Not specified in source- Step
Not specified in source
What it controls
EMA observation length used in the trend score. A closed score waits for the enabled trend warm-up.
Effect on the script
This changes the observation window or sensitivity of the named calculation feeding the workflow.
When to adjust it
Match the calculation horizon to the analytical question and keep it recorded when comparing results.
Interpretation and limits
Changing the window changes the historical context and can alter warm-up, states and observations. It does not validate a future edge.
Original input tooltip
EMA observation length used in the trend score. A closed score waits for the enabled trend warm-up.
Mid EMA Length
- Input type
int- Source default
50- Available options
Not specified in source- Minimum
3- Maximum
Not specified in source- Step
Not specified in source
What it controls
EMA observation length used in the trend score. A closed score waits for the enabled trend warm-up.
Effect on the script
This changes the observation window or sensitivity of the named calculation feeding the workflow.
When to adjust it
Match the calculation horizon to the analytical question and keep it recorded when comparing results.
Interpretation and limits
Changing the window changes the historical context and can alter warm-up, states and observations. It does not validate a future edge.
Original input tooltip
EMA observation length used in the trend score. A closed score waits for the enabled trend warm-up.
Slow EMA Length
- Input type
int- Source default
200- Available options
Not specified in source- Minimum
5- Maximum
Not specified in source- Step
Not specified in source
What it controls
EMA observation length used in the trend score. A closed score waits for the enabled trend warm-up.
Effect on the script
This changes the observation window or sensitivity of the named calculation feeding the workflow.
When to adjust it
Match the calculation horizon to the analytical question and keep it recorded when comparing results.
Interpretation and limits
Changing the window changes the historical context and can alter warm-up, states and observations. It does not validate a future edge.
Original input tooltip
EMA observation length used in the trend score. A closed score waits for the enabled trend warm-up.
Momentum Module
2 inputsRSI Length
- Input type
int- Source default
14- Available options
Not specified in source- Minimum
2- Maximum
Not specified in source- Step
Not specified in source
What it controls
Observation length used by this module. Changes recalculate historical context and descriptive evidence.
Effect on the script
This changes the observation window or sensitivity of the named calculation feeding the workflow.
When to adjust it
Match the calculation horizon to the analytical question and keep it recorded when comparing results.
Interpretation and limits
Changing the window changes the historical context and can alter warm-up, states and observations. It does not validate a future edge.
Original input tooltip
Observation length used by this module. Changes recalculate historical context and descriptive evidence.
ROC Length
- Input type
int- Source default
10- Available options
Not specified in source- Minimum
1- Maximum
Not specified in source- Step
Not specified in source
What it controls
Observation length used by this module. Changes recalculate historical context and descriptive evidence.
Effect on the script
This changes the observation window or sensitivity of the named calculation feeding the workflow.
When to adjust it
Match the calculation horizon to the analytical question and keep it recorded when comparing results.
Interpretation and limits
Changing the window changes the historical context and can alter warm-up, states and observations. It does not validate a future edge.
Original input tooltip
Observation length used by this module. Changes recalculate historical context and descriptive evidence.
Structure Module
2 inputsSwing Left Bars
- Input type
int- Source default
5- Available options
Not specified in source- Minimum
1- Maximum
Not specified in source- Step
Not specified in source
What it controls
Bars to the left used to confirm a swing pivot.
Effect on the script
This changes the swing or structural reference used by the documented detection or risk-reference calculation.
When to adjust it
Match the swing scale to the structure you intend to inspect, then review the resulting anchors and confirmation timing.
Interpretation and limits
Confirmed pivots require subsequent bars. Different settings create different structure and can change later events and observations.
Original input tooltip
Bars to the left used to confirm a swing pivot.
Swing Right Bars
- Input type
int- Source default
5- Available options
Not specified in source- Minimum
1- Maximum
Not specified in source- Step
Not specified in source
What it controls
Bars to the right used to confirm a swing pivot.
Effect on the script
This changes the swing or structural reference used by the documented detection or risk-reference calculation.
When to adjust it
Match the swing scale to the structure you intend to inspect, then review the resulting anchors and confirmation timing.
Interpretation and limits
Confirmed pivots require subsequent bars. Different settings create different structure and can change later events and observations.
Original input tooltip
Bars to the right used to confirm a swing pivot.
Volatility Module
2 inputsATR Length
- Input type
int- Source default
14- Available options
Not specified in source- Minimum
1- Maximum
Not specified in source- Step
Not specified in source
What it controls
Observation length used by this module. Changes recalculate historical context and descriptive evidence.
Effect on the script
This changes the documented volatility, risk-distance or location reference used by the analytical workflow.
When to adjust it
Set the relevant risk or distance assumption as part of a coherent plan, then inspect the resulting geometry.
Interpretation and limits
A chart reference is not an account-risk limit, a live stop or a guarantee of execution. Gaps and changing volatility can exceed the reference.
Original input tooltip
Observation length used by this module. Changes recalculate historical context and descriptive evidence.
ATR Average Length
- Input type
int- Source default
50- Available options
Not specified in source- Minimum
2- Maximum
Not specified in source- Step
Not specified in source
What it controls
Baseline used to judge expansion vs contraction.
Effect on the script
This changes the documented volatility, risk-distance or location reference used by the analytical workflow.
When to adjust it
Set the relevant risk or distance assumption as part of a coherent plan, then inspect the resulting geometry.
Interpretation and limits
A chart reference is not an account-risk limit, a live stop or a guarantee of execution. Gaps and changing volatility can exceed the reference.
Original input tooltip
Baseline used to judge expansion vs contraction.
Volume Module
2 inputsVolume Average Length
- Input type
int- Source default
20- Available options
Not specified in source- Minimum
2- Maximum
Not specified in source- Step
Not specified in source
What it controls
Observation length used by this module. Changes recalculate historical context and descriptive evidence.
Effect on the script
This changes the observation window or sensitivity of the named calculation feeding the workflow.
When to adjust it
Match the calculation horizon to the analytical question and keep it recorded when comparing results.
Interpretation and limits
Changing the window changes the historical context and can alter warm-up, states and observations. It does not validate a future edge.
Original input tooltip
Observation length used by this module. Changes recalculate historical context and descriptive evidence.
Volume Direction Lookback
- Input type
int- Source default
5- Available options
Not specified in source- Minimum
1- Maximum
Not specified in source- Step
Not specified in source
What it controls
Observation length used by this module. Changes recalculate historical context and descriptive evidence.
Effect on the script
This changes the observation window or sensitivity of the named calculation feeding the workflow.
When to adjust it
Match the calculation horizon to the analytical question and keep it recorded when comparing results.
Interpretation and limits
Changing the window changes the historical context and can alter warm-up, states and observations. It does not validate a future edge.
Original input tooltip
Observation length used by this module. Changes recalculate historical context and descriptive evidence.
Risk Location Module
2 inputsStop Buffer (ATR)
- Input type
float- Source default
0.5- Available options
Not specified in source- Minimum
0.0- Maximum
3.0- Step
0.1
What it controls
ATR multiple added beyond the structural level for the stop reference.
Effect on the script
This changes the documented volatility, risk-distance or location reference used by the analytical workflow.
When to adjust it
Set the relevant risk or distance assumption as part of a coherent plan, then inspect the resulting geometry.
Interpretation and limits
A chart reference is not an account-risk limit, a live stop or a guarantee of execution. Gaps and changing volatility can exceed the reference.
Original input tooltip
ATR multiple added beyond the structural level for the stop reference.
Target R Multiple
- Input type
float- Source default
2.0- Available options
Not specified in source- Minimum
0.5- Maximum
10.0- Step
0.5
What it controls
Reward-to-risk multiple used to project the target level.
Effect on the script
This changes the documented target or payoff geometry used by the plan, distance comparison or outcome model.
When to adjust it
Set the target assumption before evaluating observations and compare it with the active risk or volatility reference.
Interpretation and limits
A larger projected reward does not establish that the market can deliver it. References are not net returns or actual fills.
Original input tooltip
Reward-to-risk multiple used to project the target level.
State Thresholds
4 inputsWatch Threshold
- Input type
int- Source default
40- Available options
Not specified in source- Minimum
1- Maximum
99- Step
Not specified in source
What it controls
Closed score boundary. Set Watch below Prepare and Prepare below Ready; invalid ordering suspends qualified states.
Effect on the script
This changes the boundary for the named score classification or qualification gate.
When to adjust it
Specify how strict that classification should be before reviewing the resulting states and samples.
Interpretation and limits
Changing a threshold changes what qualifies. It does not improve the underlying market conditions or establish a success probability.
Original input tooltip
Closed score boundary. Set Watch below Prepare and Prepare below Ready; invalid ordering suspends qualified states.
Prepare Threshold
- Input type
int- Source default
60- Available options
Not specified in source- Minimum
1- Maximum
99- Step
Not specified in source
What it controls
Closed score boundary. Set Watch below Prepare and Prepare below Ready; invalid ordering suspends qualified states.
Effect on the script
This changes the boundary for the named score classification or qualification gate.
When to adjust it
Specify how strict that classification should be before reviewing the resulting states and samples.
Interpretation and limits
Changing a threshold changes what qualifies. It does not improve the underlying market conditions or establish a success probability.
Original input tooltip
Closed score boundary. Set Watch below Prepare and Prepare below Ready; invalid ordering suspends qualified states.
Ready Threshold
- Input type
int- Source default
80- Available options
Not specified in source- Minimum
1- Maximum
99- Step
Not specified in source
What it controls
Closed score boundary. Set Watch below Prepare and Prepare below Ready; invalid ordering suspends qualified states.
Effect on the script
This changes the boundary for the named score classification or qualification gate.
When to adjust it
Specify how strict that classification should be before reviewing the resulting states and samples.
Interpretation and limits
Changing a threshold changes what qualifies. It does not improve the underlying market conditions or establish a success probability.
Original input tooltip
Closed score boundary. Set Watch below Prepare and Prepare below Ready; invalid ordering suspends qualified states.
Bias Sensitivity
- Input type
float- Source default
10.0- Available options
Not specified in source- Minimum
0.0- Maximum
50.0- Step
1.0
What it controls
Minimum net directional strength required to assign a Long or Short bias.
Effect on the script
This changes how demanding the named qualification, pressure or pattern-fit assessment is.
When to adjust it
Define the selectivity appropriate to the specific structural or flow question before comparing examples.
Interpretation and limits
A more permissive setting can admit marginal context; stricter qualification can delay or exclude events. Neither guarantees better outcomes.
Original input tooltip
Minimum net directional strength required to assign a Long or Short bias.
On-Chart Labels
2 inputsOn-Chart State Labels
- Input type
string- Source default
"Key States Only"- Available options
["Ready Only", "Key States Only", "All Active States", "Off"]- Minimum
Not specified in source- Maximum
Not specified in source- Step
Not specified in source
What it controls
Ready Only shows only the strongest transitions. Key States Only adds Prepare. All Active States also adds Watch. Off hides on-chart state labels.
Effect on the script
This controls the visibility, placement, extent or retained history of the documented visual element. It is part of the chart presentation layer.
When to adjust it
Change it when the active reference is hard to inspect or when historical annotations compete with current price action.
Interpretation and limits
Reducing visible history or hiding an element does not improve the underlying observations. A visual projection is not a price forecast.
Original input tooltip
Ready Only shows only the strongest transitions. Key States Only adds Prepare. All Active States also adds Watch. Off hides on-chart state labels.
Label Min Spacing (bars)
- Input type
int- Source default
55- Available options
Not specified in source- Minimum
0- Maximum
Not specified in source- Step
Not specified in source
What it controls
Minimum number of bars between on-chart state labels. Higher values reduce clutter for a cleaner chart.
Effect on the script
This controls the visibility, placement, extent or retained history of the documented visual element. It is part of the chart presentation layer.
When to adjust it
Change it when the active reference is hard to inspect or when historical annotations compete with current price action.
Interpretation and limits
Reducing visible history or hiding an element does not improve the underlying observations. A visual projection is not a price forecast.
Original input tooltip
Minimum number of bars between on-chart state labels. Higher values reduce clutter for a cleaner chart.
Level Projection
3 inputsLevel Forward Bars
- Input type
int- Source default
28- Available options
Not specified in source- Minimum
8- Maximum
180- Step
Not specified in source
What it controls
Solid reference projection and forward annotation spacing. This does not forecast a future price.
Effect on the script
This controls the visibility, placement, extent or retained history of the documented visual element. It is part of the chart presentation layer.
When to adjust it
Change it when the active reference is hard to inspect or when historical annotations compete with current price action.
Interpretation and limits
Reducing visible history or hiding an element does not improve the underlying observations. A visual projection is not a price forecast.
Original input tooltip
Solid reference projection and forward annotation spacing. This does not forecast a future price.
Level Back Bars
- Input type
int- Source default
8- Available options
Not specified in source- Minimum
0- Maximum
120- Step
Not specified in source
What it controls
Number of bars used to extend the current reference rail behind the latest chart bar.
Effect on the script
This supplies the documented value to the associated analytical component.
When to adjust it
Change it when intentionally defining a different analytical assumption, keeping the other settings stable for comparison.
Interpretation and limits
A different configuration changes the model being reviewed; it does not promise a better trading outcome.
Original input tooltip
Number of bars used to extend the current reference rail behind the latest chart bar.
Label Offset (ATR)
- Input type
float- Source default
0.5- Available options
Not specified in source- Minimum
0.0- Maximum
5.0- Step
0.1
What it controls
Distance labels are floated away from price, in ATR multiples.
Effect on the script
This controls the visibility, placement, extent or retained history of the documented visual element. It is part of the chart presentation layer.
When to adjust it
Change it when the active reference is hard to inspect or when historical annotations compete with current price action.
Interpretation and limits
Reducing visible history or hiding an element does not improve the underlying observations. A visual projection is not a price forecast.
Original input tooltip
Distance labels are floated away from price, in ATR multiples.
Keep the settings in context
Change one analytical assumption at a time and compare the same instrument, timeframe and history. A chart reference, score, observation rate or input default does not establish a trade fill, a forward probability or a guaranteed outcome.
Return to the product overview · View this script on TradingView