Use your browser’s Find (Ctrl+F / ⌘F) to locate a setting. Open its row for the full explanation and limits. Source-check time is a verification timestamp, not a script publication date.
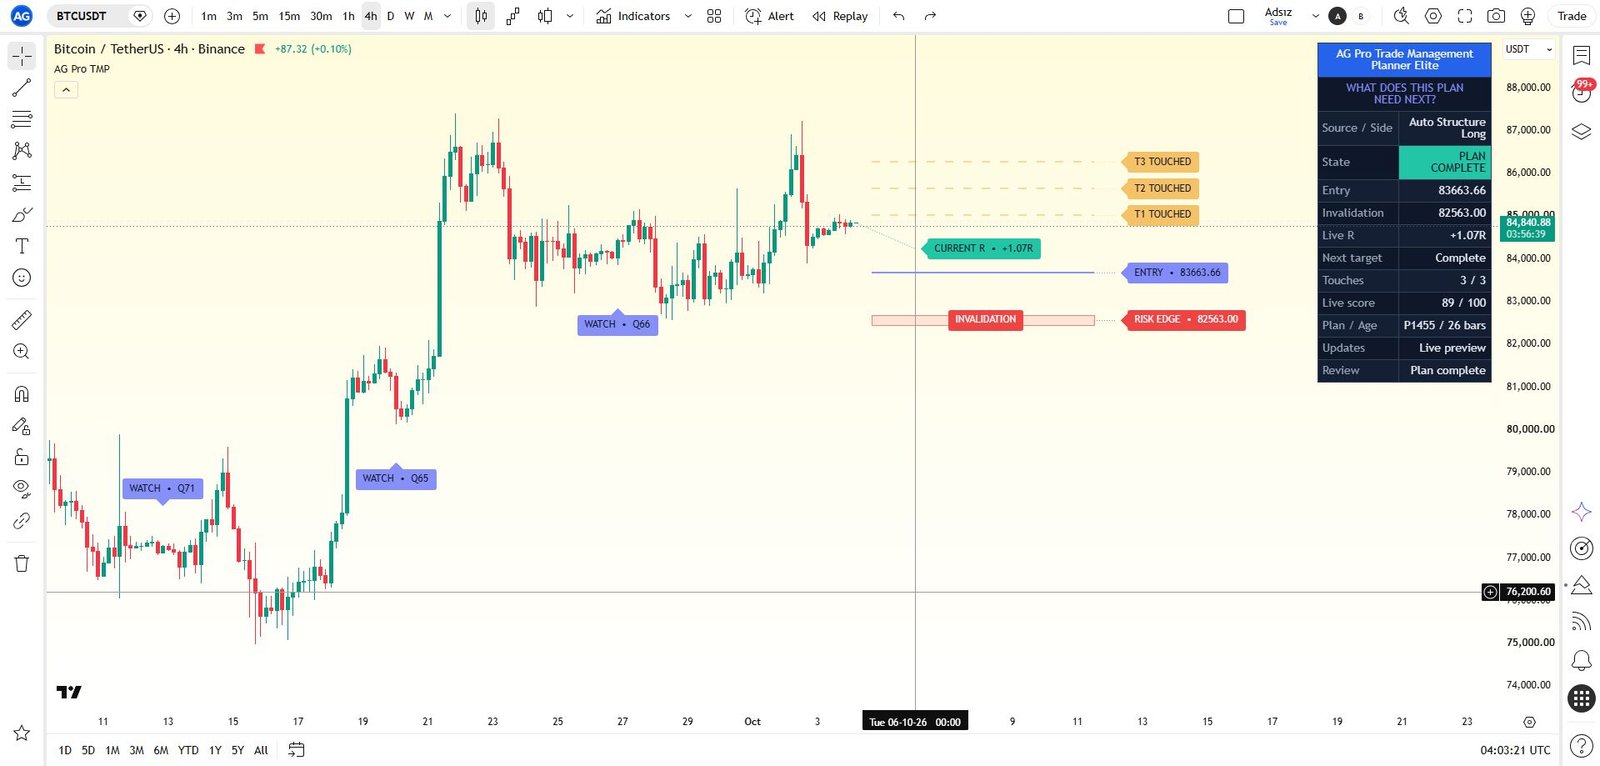
Plan Setup
8 inputsPlan Source
- Input type
string- Source default
"Auto Structure"- Available options
["Manual Price", "Auto Structure"]- Minimum
Not specified in source- Maximum
Not specified in source- Step
Not specified in source
What it controls
Manual Price uses your entry and invalidation references. Auto Structure builds a conservative working plan from recent swing context.
Effect on the script
This selects which documented analytical mode, source or directional context the workflow evaluates.
When to adjust it
Choose the mode that corresponds to your actual analysis before inspecting historical examples.
Interpretation and limits
A selected direction or model is a configuration choice, not evidence that price must follow it.
Original input tooltip
Manual Price uses your entry and invalidation references. Auto Structure builds a conservative working plan from recent swing context.
Plan Side
- Input type
string- Source default
"Auto"- Available options
["Auto", "Long Management", "Short Management"]- Minimum
Not specified in source- Maximum
Not specified in source- Step
Not specified in source
What it controls
Selects the management side. Auto infers side from manual invalidation or from trend/swing context in Auto Structure mode.
Effect on the script
This selects which documented analytical mode, source or directional context the workflow evaluates.
When to adjust it
Choose the mode that corresponds to your actual analysis before inspecting historical examples.
Interpretation and limits
A selected direction or model is a configuration choice, not evidence that price must follow it.
Original input tooltip
Selects the management side. Auto infers side from manual invalidation or from trend/swing context in Auto Structure mode.
Manual Entry
- Input type
price- Source default
0.0- Available options
Not specified in source- Minimum
Not specified in source- Maximum
Not specified in source- Step
Not specified in source
What it controls
Manual entry reference used only when Plan Source is Manual Price. It is a planning reference, not an order command.
Effect on the script
This supplies the specified price reference to the documented manual or hybrid planning path.
When to adjust it
Enter a reference belonging to an independently defined plan and verify the selected plan source and target model.
Interpretation and limits
A plotted price reference is not a live order or validation of the plan; invalid geometry can block useful output.
Original input tooltip
Manual entry reference used only when Plan Source is Manual Price. It is a planning reference, not an order command.
Manual Invalidation
- Input type
price- Source default
0.0- Available options
Not specified in source- Minimum
Not specified in source- Maximum
Not specified in source- Step
Not specified in source
What it controls
Manual invalidation reference used only when Plan Source is Manual Price. It is a planning reference, not financial advice.
Effect on the script
This supplies the specified price reference to the documented manual or hybrid planning path.
When to adjust it
Enter a reference belonging to an independently defined plan and verify the selected plan source and target model.
Interpretation and limits
A plotted price reference is not a live order or validation of the plan; invalid geometry can block useful output.
Original input tooltip
Manual invalidation reference used only when Plan Source is Manual Price. It is a planning reference, not financial advice.
Optional Target Anchor
- Input type
price- Source default
0.0- Available options
Not specified in source- Minimum
Not specified in source- Maximum
Not specified in source- Step
Not specified in source
What it controls
Optional structure target anchor. When Hybrid Targets is selected, this anchor can influence the target ladder.
Effect on the script
This supplies the specified price reference to the documented manual or hybrid planning path.
When to adjust it
Enter a reference belonging to an independently defined plan and verify the selected plan source and target model.
Interpretation and limits
A plotted price reference is not a live order or validation of the plan; invalid geometry can block useful output.
Original input tooltip
Optional structure target anchor. When Hybrid Targets is selected, this anchor can influence the target ladder.
Manual Plan Start
- Input type
time- Source default
0- Available options
Not specified in source- Minimum
Not specified in source- Maximum
Not specified in source- Step
Not specified in source
What it controls
Manual plans start at the close of the first chart bar at or after this timestamp. 0 starts at the first available bar; past touches may already resolve that plan. Select a recent timestamp for a new plan.
Effect on the script
This chooses the first eligible manual-plan start close at or after the selected timestamp.
When to adjust it
Choose a recent timestamp when examining a new plan rather than implicitly replaying one from the first loaded bar.
Interpretation and limits
With a historical start, earlier touches may already have resolved the plan. The script does not reconstruct broker positions.
Original input tooltip
Manual plans start at the close of the first chart bar at or after this timestamp. 0 starts at the first available bar; past touches may already resolve that plan. Select a recent timestamp for a new plan.
Auto Structure Pivot Length
- Input type
int- Source default
8- Available options
Not specified in source- Minimum
2- Maximum
50- Step
Not specified in source
What it controls
Pivot length used by Auto Structure mode to identify conservative swing references.
Effect on the script
This changes the swing or structural reference used by the documented detection or risk-reference calculation.
When to adjust it
Match the swing scale to the structure you intend to inspect, then review the resulting anchors and confirmation timing.
Interpretation and limits
Confirmed pivots require subsequent bars. Different settings create different structure and can change later events and observations.
Original input tooltip
Pivot length used by Auto Structure mode to identify conservative swing references.
Auto Structure Lookback
- Input type
int- Source default
120- Available options
Not specified in source- Minimum
30- Maximum
500- Step
Not specified in source
What it controls
Lookback used by Auto Structure mode for fallback swing references.
Effect on the script
This changes the swing or structural reference used by the documented detection or risk-reference calculation.
When to adjust it
Match the swing scale to the structure you intend to inspect, then review the resulting anchors and confirmation timing.
Interpretation and limits
Confirmed pivots require subsequent bars. Different settings create different structure and can change later events and observations.
Original input tooltip
Lookback used by Auto Structure mode for fallback swing references.
Risk / Management Logic
9 inputsATR Length
- Input type
int- Source default
14- Available options
Not specified in source- Minimum
2- Maximum
100- Step
Not specified in source
What it controls
ATR length used for volatility context, label spacing, zone thickness, and management score normalization.
Effect on the script
This changes the documented volatility, risk-distance or location reference used by the analytical workflow.
When to adjust it
Set the relevant risk or distance assumption as part of a coherent plan, then inspect the resulting geometry.
Interpretation and limits
A chart reference is not an account-risk limit, a live stop or a guarantee of execution. Gaps and changing volatility can exceed the reference.
Original input tooltip
ATR length used for volatility context, label spacing, zone thickness, and management score normalization.
Auto Invalidation Mode
- Input type
string- Source default
"Swing + ATR"- Available options
["Swing + ATR", "ATR Multiple", "Percent"]- Minimum
Not specified in source- Maximum
Not specified in source- Step
Not specified in source
What it controls
Auto Structure invalidation method. Swing + ATR anchors beyond the latest opposite swing when available.
Effect on the script
This selects which documented analytical mode, source or directional context the workflow evaluates.
When to adjust it
Choose the mode that corresponds to your actual analysis before inspecting historical examples.
Interpretation and limits
A selected direction or model is a configuration choice, not evidence that price must follow it.
Original input tooltip
Auto Structure invalidation method. Swing + ATR anchors beyond the latest opposite swing when available.
Auto ATR Multiple
- Input type
float- Source default
1.35- Available options
Not specified in source- Minimum
0.2- Maximum
8.0- Step
0.05
What it controls
ATR distance used by Auto Structure mode when building an invalidation reference.
Effect on the script
This changes the documented volatility, risk-distance or location reference used by the analytical workflow.
When to adjust it
Set the relevant risk or distance assumption as part of a coherent plan, then inspect the resulting geometry.
Interpretation and limits
A chart reference is not an account-risk limit, a live stop or a guarantee of execution. Gaps and changing volatility can exceed the reference.
Original input tooltip
ATR distance used by Auto Structure mode when building an invalidation reference.
Auto Percent Distance
- Input type
float- Source default
1.5- Available options
Not specified in source- Minimum
0.1- Maximum
20.0- Step
0.1
What it controls
Percent distance used by Auto Structure mode when Auto Invalidation Mode is Percent.
Effect on the script
This supplies the documented value to the associated analytical component.
When to adjust it
Change it when intentionally defining a different analytical assumption, keeping the other settings stable for comparison.
Interpretation and limits
A different configuration changes the model being reviewed; it does not promise a better trading outcome.
Original input tooltip
Percent distance used by Auto Structure mode when Auto Invalidation Mode is Percent.
Auto Minimum Risk ATR
- Input type
float- Source default
0.45- Available options
Not specified in source- Minimum
0.1- Maximum
4.0- Step
0.05
What it controls
Minimum Auto Structure risk distance. This prevents the live entry and invalidation reference from collapsing into the same price area.
Effect on the script
This changes the documented volatility, risk-distance or location reference used by the analytical workflow.
When to adjust it
Set the relevant risk or distance assumption as part of a coherent plan, then inspect the resulting geometry.
Interpretation and limits
A chart reference is not an account-risk limit, a live stop or a guarantee of execution. Gaps and changing volatility can exceed the reference.
Original input tooltip
Minimum Auto Structure risk distance. This prevents the live entry and invalidation reference from collapsing into the same price area.
Auto Maximum Risk ATR
- Input type
float- Source default
2.4- Available options
Not specified in source- Minimum
0.6- Maximum
12.0- Step
0.05
What it controls
Maximum Auto Structure risk distance. This keeps distant historical swings from creating unusable target ladders on high timeframes.
Effect on the script
This changes the swing or structural reference used by the documented detection or risk-reference calculation.
When to adjust it
Match the swing scale to the structure you intend to inspect, then review the resulting anchors and confirmation timing.
Interpretation and limits
Confirmed pivots require subsequent bars. Different settings create different structure and can change later events and observations.
Original input tooltip
Maximum Auto Structure risk distance. This keeps distant historical swings from creating unusable target ladders on high timeframes.
Review Buffer ATR
- Input type
float- Source default
0.22- Available options
Not specified in source- Minimum
0.02- Maximum
2.0- Step
0.01
What it controls
ATR buffer around invalidation and targets used to trigger review states.
Effect on the script
This changes the documented volatility, risk-distance or location reference used by the analytical workflow.
When to adjust it
Set the relevant risk or distance assumption as part of a coherent plan, then inspect the resulting geometry.
Interpretation and limits
A chart reference is not an account-risk limit, a live stop or a guarantee of execution. Gaps and changing volatility can exceed the reference.
Original input tooltip
ATR buffer around invalidation and targets used to trigger review states.
Ready Threshold
- Input type
int- Source default
72- Available options
Not specified in source- Minimum
45- Maximum
95- Step
Not specified in source
What it controls
Management score required for READY state. This score measures planning clarity, not win probability. Ready and Watch thresholds are normalized automatically if entered in reverse order.
Effect on the script
This changes the boundary for the named score classification or qualification gate.
When to adjust it
Specify how strict that classification should be before reviewing the resulting states and samples.
Interpretation and limits
Changing a threshold changes what qualifies. It does not improve the underlying market conditions or establish a success probability.
Original input tooltip
Management score required for READY state. This score measures planning clarity, not win probability. Ready and Watch thresholds are normalized automatically if entered in reverse order.
Watch Threshold
- Input type
int- Source default
55- Available options
Not specified in source- Minimum
20- Maximum
90- Step
Not specified in source
What it controls
Management score required for WATCH state before READY. Ready and Watch thresholds are normalized automatically if entered in reverse order.
Effect on the script
This changes the boundary for the named score classification or qualification gate.
When to adjust it
Specify how strict that classification should be before reviewing the resulting states and samples.
Interpretation and limits
Changing a threshold changes what qualifies. It does not improve the underlying market conditions or establish a success probability.
Original input tooltip
Management score required for WATCH state before READY. Ready and Watch thresholds are normalized automatically if entered in reverse order.
Target Ladder
12 inputsTarget Model
- Input type
string- Source default
"Hybrid Targets"- Available options
["R-Multiple", "Hybrid Targets", "Conservative"]- Minimum
Not specified in source- Maximum
Not specified in source- Step
Not specified in source
What it controls
R-Multiple uses risk distance only. Hybrid blends R targets with an optional structure anchor. Conservative uses the nearer practical target between R and structure reference.
Effect on the script
This changes the documented target or payoff geometry used by the plan, distance comparison or outcome model.
When to adjust it
Set the target assumption before evaluating observations and compare it with the active risk or volatility reference.
Interpretation and limits
A larger projected reward does not establish that the market can deliver it. References are not net returns or actual fills.
Original input tooltip
R-Multiple uses risk distance only. Hybrid blends R targets with an optional structure anchor. Conservative uses the nearer practical target between R and structure reference.
Target Count
- Input type
int- Source default
3- Available options
Not specified in source- Minimum
2- Maximum
5- Step
Not specified in source
What it controls
Number of target tiers shown in the management ladder.
Effect on the script
This sets how many configured target tiers participate in the visible management ladder.
When to adjust it
Choose the number of tiers that belongs to the plan you intend to review.
Interpretation and limits
More tiers do not improve target reach or cause any real partial execution.
Original input tooltip
Number of target tiers shown in the management ladder.
Target 1 R
- Input type
float- Source default
1.0- Available options
Not specified in source- Minimum
0.25- Maximum
20.0- Step
0.25
What it controls
Sets the R-multiple reference for target 1. R is measured from the active plan risk distance.
Effect on the script
This changes the documented target or payoff geometry used by the plan, distance comparison or outcome model.
When to adjust it
Set the target assumption before evaluating observations and compare it with the active risk or volatility reference.
Interpretation and limits
A larger projected reward does not establish that the market can deliver it. References are not net returns or actual fills.
Alloc %
- Input type
float- Source default
25- Available options
Not specified in source- Minimum
0- Maximum
100- Step
1
What it controls
Sets the allocation-percentage reference for this target tier. It is part of the analytical ladder, not an instruction sent to a broker.
Effect on the script
This sets the allocation reference for this target tier in the modeled management ladder.
When to adjust it
Specify the tier distribution consistently with your separate management plan.
Interpretation and limits
Allocation references do not submit partial orders or confirm that the corresponding quantity was sold.
Target 2 R
- Input type
float- Source default
2.0- Available options
Not specified in source- Minimum
0.25- Maximum
20.0- Step
0.25
What it controls
Sets the R-multiple reference for target 2. R is measured from the active plan risk distance.
Effect on the script
This changes the documented target or payoff geometry used by the plan, distance comparison or outcome model.
When to adjust it
Set the target assumption before evaluating observations and compare it with the active risk or volatility reference.
Interpretation and limits
A larger projected reward does not establish that the market can deliver it. References are not net returns or actual fills.
Alloc %
- Input type
float- Source default
25- Available options
Not specified in source- Minimum
0- Maximum
100- Step
1
What it controls
Sets the allocation-percentage reference for this target tier. It is part of the analytical ladder, not an instruction sent to a broker.
Effect on the script
This sets the allocation reference for this target tier in the modeled management ladder.
When to adjust it
Specify the tier distribution consistently with your separate management plan.
Interpretation and limits
Allocation references do not submit partial orders or confirm that the corresponding quantity was sold.
Target 3 R
- Input type
float- Source default
3.0- Available options
Not specified in source- Minimum
0.25- Maximum
20.0- Step
0.25
What it controls
Sets the R-multiple reference for target 3. R is measured from the active plan risk distance.
Effect on the script
This changes the documented target or payoff geometry used by the plan, distance comparison or outcome model.
When to adjust it
Set the target assumption before evaluating observations and compare it with the active risk or volatility reference.
Interpretation and limits
A larger projected reward does not establish that the market can deliver it. References are not net returns or actual fills.
Alloc %
- Input type
float- Source default
25- Available options
Not specified in source- Minimum
0- Maximum
100- Step
1
What it controls
Sets the allocation-percentage reference for this target tier. It is part of the analytical ladder, not an instruction sent to a broker.
Effect on the script
This sets the allocation reference for this target tier in the modeled management ladder.
When to adjust it
Specify the tier distribution consistently with your separate management plan.
Interpretation and limits
Allocation references do not submit partial orders or confirm that the corresponding quantity was sold.
Target 4 R
- Input type
float- Source default
4.0- Available options
Not specified in source- Minimum
0.25- Maximum
20.0- Step
0.25
What it controls
Sets the R-multiple reference for target 4. R is measured from the active plan risk distance.
Effect on the script
This changes the documented target or payoff geometry used by the plan, distance comparison or outcome model.
When to adjust it
Set the target assumption before evaluating observations and compare it with the active risk or volatility reference.
Interpretation and limits
A larger projected reward does not establish that the market can deliver it. References are not net returns or actual fills.
Alloc %
- Input type
float- Source default
15- Available options
Not specified in source- Minimum
0- Maximum
100- Step
1
What it controls
Sets the allocation-percentage reference for this target tier. It is part of the analytical ladder, not an instruction sent to a broker.
Effect on the script
This sets the allocation reference for this target tier in the modeled management ladder.
When to adjust it
Specify the tier distribution consistently with your separate management plan.
Interpretation and limits
Allocation references do not submit partial orders or confirm that the corresponding quantity was sold.
Target 5 R
- Input type
float- Source default
6.0- Available options
Not specified in source- Minimum
0.25- Maximum
30.0- Step
0.25
What it controls
Sets the R-multiple reference for target 5. R is measured from the active plan risk distance.
Effect on the script
This changes the documented target or payoff geometry used by the plan, distance comparison or outcome model.
When to adjust it
Set the target assumption before evaluating observations and compare it with the active risk or volatility reference.
Interpretation and limits
A larger projected reward does not establish that the market can deliver it. References are not net returns or actual fills.
Alloc %
- Input type
float- Source default
10- Available options
Not specified in source- Minimum
0- Maximum
100- Step
1
What it controls
Sets the allocation-percentage reference for this target tier. It is part of the analytical ladder, not an instruction sent to a broker.
Effect on the script
This sets the allocation reference for this target tier in the modeled management ladder.
When to adjust it
Specify the tier distribution consistently with your separate management plan.
Interpretation and limits
Allocation references do not submit partial orders or confirm that the corresponding quantity was sold.
Historical Evidence
1 inputT1 Sample Window (Bars)
- Input type
int- Source default
240- Available options
Not specified in source- Minimum
20- Maximum
1000- Step
Not specified in source
What it controls
Defines how many completed bars a historical T1 sample may take to reach Target 1 before it is conservatively resolved as not reached.
Effect on the script
This sets the documented age, waiting period or forward observation deadline used by the event lifecycle.
When to adjust it
Match the review horizon to the question being studied and keep the deadline explicit in historical comparisons.
Interpretation and limits
Changing a deadline changes which observations resolve, expire or remain eligible. A timed model observation is not a broker trade.
Original input tooltip
Defines how many completed bars a historical T1 sample may take to reach Target 1 before it is conservatively resolved as not reached.
Visuals
9 inputsVisual Preset
- Input type
string- Source default
"Balanced"- Available options
["Clean", "Balanced", "Rich"]- Minimum
Not specified in source- Maximum
Not specified in source- Step
Not specified in source
What it controls
Selects default chart density. Clean is lighter, Balanced is publication-ready, Rich adds stronger target bands and more context.
Effect on the script
This controls the visibility, placement, extent or retained history of the documented visual element. It is part of the chart presentation layer.
When to adjust it
Change it when the active reference is hard to inspect or when historical annotations compete with current price action.
Interpretation and limits
Reducing visible history or hiding an element does not improve the underlying observations. A visual projection is not a price forecast.
Original input tooltip
Selects default chart density. Clean is lighter, Balanced is publication-ready, Rich adds stronger target bands and more context.
Show Entry Reference
- Input type
bool- Source default
true- Available options
Not specified in source- Minimum
Not specified in source- Maximum
Not specified in source- Step
Not specified in source
What it controls
Toggles show entry reference for the current workflow.
Effect on the script
This controls the visibility, placement, extent or retained history of the documented visual element. It is part of the chart presentation layer.
When to adjust it
Change it when the active reference is hard to inspect or when historical annotations compete with current price action.
Interpretation and limits
Reducing visible history or hiding an element does not improve the underlying observations. A visual projection is not a price forecast.
Show Invalidation Zone
- Input type
bool- Source default
true- Available options
Not specified in source- Minimum
Not specified in source- Maximum
Not specified in source- Step
Not specified in source
What it controls
Toggles show invalidation zone for the current workflow.
Effect on the script
This controls the visibility, placement, extent or retained history of the documented visual element. It is part of the chart presentation layer.
When to adjust it
Change it when the active reference is hard to inspect or when historical annotations compete with current price action.
Interpretation and limits
Reducing visible history or hiding an element does not improve the underlying observations. A visual projection is not a price forecast.
Show Target Ladder
- Input type
bool- Source default
true- Available options
Not specified in source- Minimum
Not specified in source- Maximum
Not specified in source- Step
Not specified in source
What it controls
Toggles show target ladder for the current workflow.
Effect on the script
This controls the visibility, placement, extent or retained history of the documented visual element. It is part of the chart presentation layer.
When to adjust it
Change it when the active reference is hard to inspect or when historical annotations compete with current price action.
Interpretation and limits
Reducing visible history or hiding an element does not improve the underlying observations. A visual projection is not a price forecast.
Show Next Target Band
- Input type
bool- Source default
true- Available options
Not specified in source- Minimum
Not specified in source- Maximum
Not specified in source- Step
Not specified in source
What it controls
Toggles show next target band for the current workflow.
Effect on the script
This controls the visibility, placement, extent or retained history of the documented visual element. It is part of the chart presentation layer.
When to adjust it
Change it when the active reference is hard to inspect or when historical annotations compete with current price action.
Interpretation and limits
Reducing visible history or hiding an element does not improve the underlying observations. A visual projection is not a price forecast.
Show Current R Label
- Input type
bool- Source default
true- Available options
Not specified in source- Minimum
Not specified in source- Maximum
Not specified in source- Step
Not specified in source
What it controls
Toggles show current r label for the current workflow.
Effect on the script
This controls the visibility, placement, extent or retained history of the documented visual element. It is part of the chart presentation layer.
When to adjust it
Change it when the active reference is hard to inspect or when historical annotations compete with current price action.
Interpretation and limits
Reducing visible history or hiding an element does not improve the underlying observations. A visual projection is not a price forecast.
Forward Projection Bars
- Input type
int- Source default
44- Available options
Not specified in source- Minimum
8- Maximum
240- Step
Not specified in source
What it controls
Number of bars projected to the right for entry, invalidation, target ladder, and review zones.
Effect on the script
This controls the visibility, placement, extent or retained history of the documented visual element. It is part of the chart presentation layer.
When to adjust it
Change it when the active reference is hard to inspect or when historical annotations compete with current price action.
Interpretation and limits
Reducing visible history or hiding an element does not improve the underlying observations. A visual projection is not a price forecast.
Original input tooltip
Number of bars projected to the right for entry, invalidation, target ladder, and review zones.
Zone Transparency
- Input type
int- Source default
88- Available options
Not specified in source- Minimum
70- Maximum
96- Step
Not specified in source
What it controls
Sets zone transparency within the Visuals controls.
Effect on the script
This supplies the documented value to the associated analytical component.
When to adjust it
Change it when intentionally defining a different analytical assumption, keeping the other settings stable for comparison.
Interpretation and limits
A different configuration changes the model being reviewed; it does not promise a better trading outcome.
Zone Half-Width ATR
- Input type
float- Source default
0.18- Available options
Not specified in source- Minimum
0.03- Maximum
1.5- Step
0.01
What it controls
Sets zone half-width atr within the Visuals controls.
Effect on the script
This changes the documented volatility, risk-distance or location reference used by the analytical workflow.
When to adjust it
Set the relevant risk or distance assumption as part of a coherent plan, then inspect the resulting geometry.
Interpretation and limits
A chart reference is not an account-risk limit, a live stop or a guarantee of execution. Gaps and changing volatility can exceed the reference.
Labels
8 inputsShow Labels
- Input type
bool- Source default
true- Available options
Not specified in source- Minimum
Not specified in source- Maximum
Not specified in source- Step
Not specified in source
What it controls
Shows active management labels and sparse historical state labels.
Effect on the script
This controls the visibility, placement, extent or retained history of the documented visual element. It is part of the chart presentation layer.
When to adjust it
Change it when the active reference is hard to inspect or when historical annotations compete with current price action.
Interpretation and limits
Reducing visible history or hiding an element does not improve the underlying observations. A visual projection is not a price forecast.
Original input tooltip
Shows active management labels and sparse historical state labels.
State Label Mode
- Input type
string- Source default
"Key States"- Available options
["Off", "Key States", "All State Shifts"]- Minimum
Not specified in source- Maximum
Not specified in source- Step
Not specified in source
What it controls
Controls historical state labels. Key States keeps the chart alive without turning it into a signal wall.
Effect on the script
This controls the visibility, placement, extent or retained history of the documented visual element. It is part of the chart presentation layer.
When to adjust it
Change it when the active reference is hard to inspect or when historical annotations compete with current price action.
Interpretation and limits
Reducing visible history or hiding an element does not improve the underlying observations. A visual projection is not a price forecast.
Original input tooltip
Controls historical state labels. Key States keeps the chart alive without turning it into a signal wall.
Show Score On Labels
- Input type
bool- Source default
true- Available options
Not specified in source- Minimum
Not specified in source- Maximum
Not specified in source- Step
Not specified in source
What it controls
Toggles show score on labels for the current workflow.
Effect on the script
This controls the visibility, placement, extent or retained history of the documented visual element. It is part of the chart presentation layer.
When to adjust it
Change it when the active reference is hard to inspect or when historical annotations compete with current price action.
Interpretation and limits
Reducing visible history or hiding an element does not improve the underlying observations. A visual projection is not a price forecast.
Minimum Historical Label Score
- Input type
int- Source default
65- Available options
Not specified in source- Minimum
0- Maximum
100- Step
Not specified in source
What it controls
Filters routine historical state labels by management score. Critical invalidation and completion states remain eligible regardless of this threshold.
Effect on the script
This controls the visibility, placement, extent or retained history of the documented visual element. It is part of the chart presentation layer.
When to adjust it
Change it when the active reference is hard to inspect or when historical annotations compete with current price action.
Interpretation and limits
Reducing visible history or hiding an element does not improve the underlying observations. A visual projection is not a price forecast.
Original input tooltip
Filters routine historical state labels by management score. Critical invalidation and completion states remain eligible regardless of this threshold.
State Label Cooldown
- Input type
int- Source default
38- Available options
Not specified in source- Minimum
2- Maximum
120- Step
Not specified in source
What it controls
Sets state label cooldown within the Labels controls.
Effect on the script
This controls the visibility, placement, extent or retained history of the documented visual element. It is part of the chart presentation layer.
When to adjust it
Change it when the active reference is hard to inspect or when historical annotations compete with current price action.
Interpretation and limits
Reducing visible history or hiding an element does not improve the underlying observations. A visual projection is not a price forecast.
Max State Labels
- Input type
int- Source default
12- Available options
Not specified in source- Minimum
4- Maximum
60- Step
Not specified in source
What it controls
Sets max state labels within the Labels controls.
Effect on the script
This controls the visibility, placement, extent or retained history of the documented visual element. It is part of the chart presentation layer.
When to adjust it
Change it when the active reference is hard to inspect or when historical annotations compete with current price action.
Interpretation and limits
Reducing visible history or hiding an element does not improve the underlying observations. A visual projection is not a price forecast.
Label Offset ATR
- Input type
float- Source default
1.05- Available options
Not specified in source- Minimum
0.1- Maximum
4.0- Step
0.05
What it controls
Sets label offset atr within the Labels controls.
Effect on the script
This controls the visibility, placement, extent or retained history of the documented visual element. It is part of the chart presentation layer.
When to adjust it
Change it when the active reference is hard to inspect or when historical annotations compete with current price action.
Interpretation and limits
Reducing visible history or hiding an element does not improve the underlying observations. A visual projection is not a price forecast.
Label Font Size
- Input type
string- Source default
"Normal"- Available options
["Tiny", "Small", "Normal", "Large"]- Minimum
Not specified in source- Maximum
Not specified in source- Step
Not specified in source
What it controls
Sets label font size within the Labels controls.
Effect on the script
This changes presentation and legibility of the relevant chart element, rather than the underlying analytical model.
When to adjust it
Change it when the chart background, screen size or other overlays make the current presentation difficult to read.
Interpretation and limits
A visual preference does not strengthen the measured setup or alter its uncertainty.
Panel
5 inputsShow Panel
- Input type
bool- Source default
true- Available options
Not specified in source- Minimum
Not specified in source- Maximum
Not specified in source- Step
Not specified in source
What it controls
Shows the AG Pro management panel with plan geometry, progress, observed T1 sample rate, its 90% confidence floor, management score, plan state, and current review.
Effect on the script
This controls the visibility, placement, extent or retained history of the documented visual element. It is part of the chart presentation layer.
When to adjust it
Change it when the active reference is hard to inspect or when historical annotations compete with current price action.
Interpretation and limits
Reducing visible history or hiding an element does not improve the underlying observations. A visual projection is not a price forecast.
Original input tooltip
Shows the AG Pro management panel with plan geometry, progress, observed T1 sample rate, its 90% confidence floor, management score, plan state, and current review.
Panel Location
- Input type
string- Source default
"Top Right"- Available options
["Top Left", "Top Right", "Middle Left", "Middle Right", "Bottom Left", "Bottom Right"]- Minimum
Not specified in source- Maximum
Not specified in source- Step
Not specified in source
What it controls
Moves the AG Pro management panel to the preferred chart corner.
Effect on the script
This changes presentation and legibility of the relevant chart element, rather than the underlying analytical model.
When to adjust it
Change it when the chart background, screen size or other overlays make the current presentation difficult to read.
Interpretation and limits
A visual preference does not strengthen the measured setup or alter its uncertainty.
Original input tooltip
Moves the AG Pro management panel to the preferred chart corner.
Panel Theme
- Input type
string- Source default
"Dark"- Available options
["Dark", "Light"]- Minimum
Not specified in source- Maximum
Not specified in source- Step
Not specified in source
What it controls
Controls panel colors. Dark is the official AGPro release style; Light is for bright chart layouts.
Effect on the script
This changes presentation and legibility of the relevant chart element, rather than the underlying analytical model.
When to adjust it
Change it when the chart background, screen size or other overlays make the current presentation difficult to read.
Interpretation and limits
A visual preference does not strengthen the measured setup or alter its uncertainty.
Original input tooltip
Controls panel colors. Dark is the official AGPro release style; Light is for bright chart layouts.
Panel Page
- Input type
string- Source default
"Plan"- Available options
["Plan", "Samples"]- Minimum
Not specified in source- Maximum
Not specified in source- Step
Not specified in source
What it controls
Plan shows active geometry and lifecycle. Samples shows the separate sequential T1 model, its audit and uncertainty. Sample results are not outcomes of the displayed plan.
Effect on the script
This selects which part of the existing analytical readout is visible in the dashboard. It does not create a different event engine.
When to adjust it
Use a compact or overview page for routine reading and the detailed pages when inspecting assumptions, observations or exclusions.
Interpretation and limits
Information hidden by a page choice can still matter. Check the evidence and model assumptions before relying on a headline score.
Original input tooltip
Plan shows active geometry and lifecycle. Samples shows the separate sequential T1 model, its audit and uncertainty. Sample results are not outcomes of the displayed plan.
Panel Font Size
- Input type
string- Source default
"Normal"- Available options
["Tiny", "Small", "Normal", "Large"]- Minimum
Not specified in source- Maximum
Not specified in source- Step
Not specified in source
What it controls
Sets panel font size within the Panel controls.
Effect on the script
This changes presentation and legibility of the relevant chart element, rather than the underlying analytical model.
When to adjust it
Change it when the chart background, screen size or other overlays make the current presentation difficult to read.
Interpretation and limits
A visual preference does not strengthen the measured setup or alter its uncertainty.
Alerts
4 inputsAlert On Ready State
- Input type
bool- Source default
true- Available options
Not specified in source- Minimum
Not specified in source- Maximum
Not specified in source- Step
Not specified in source
What it controls
Toggles alert on ready state for the current workflow.
Effect on the script
This enables or disables the corresponding script alert condition for its documented event. It does not submit an order.
When to adjust it
Enable the events you intend to monitor, then configure the TradingView alert with the desired saved inputs and delivery options.
Interpretation and limits
Changing an input does not itself create or refresh an existing server alert. Alert delivery and execution are separate from the analytical event.
Alert On State Shift
- Input type
bool- Source default
true- Available options
Not specified in source- Minimum
Not specified in source- Maximum
Not specified in source- Step
Not specified in source
What it controls
Toggles alert on state shift for the current workflow.
Effect on the script
This enables or disables the corresponding script alert condition for its documented event. It does not submit an order.
When to adjust it
Enable the events you intend to monitor, then configure the TradingView alert with the desired saved inputs and delivery options.
Interpretation and limits
Changing an input does not itself create or refresh an existing server alert. Alert delivery and execution are separate from the analytical event.
Alert On Target Review
- Input type
bool- Source default
true- Available options
Not specified in source- Minimum
Not specified in source- Maximum
Not specified in source- Step
Not specified in source
What it controls
Toggles alert on target review for the current workflow.
Effect on the script
This enables or disables the corresponding script alert condition for its documented event. It does not submit an order.
When to adjust it
Enable the events you intend to monitor, then configure the TradingView alert with the desired saved inputs and delivery options.
Interpretation and limits
Changing an input does not itself create or refresh an existing server alert. Alert delivery and execution are separate from the analytical event.
Alert On Invalidation Review
- Input type
bool- Source default
true- Available options
Not specified in source- Minimum
Not specified in source- Maximum
Not specified in source- Step
Not specified in source
What it controls
Toggles alert on invalidation review for the current workflow.
Effect on the script
This enables or disables the corresponding script alert condition for its documented event. It does not submit an order.
When to adjust it
Enable the events you intend to monitor, then configure the TradingView alert with the desired saved inputs and delivery options.
Interpretation and limits
Changing an input does not itself create or refresh an existing server alert. Alert delivery and execution are separate from the analytical event.
Keep the settings in context
Change one analytical assumption at a time and compare the same instrument, timeframe and history. A chart reference, score, observation rate or input default does not establish a trade fill, a forward probability or a guaranteed outcome.
Return to the product overview · View this script on TradingView