Use your browser’s Find (Ctrl+F / ⌘F) to locate a setting. Open its row for the full explanation and limits. Source-check time is a verification timestamp, not a script publication date.
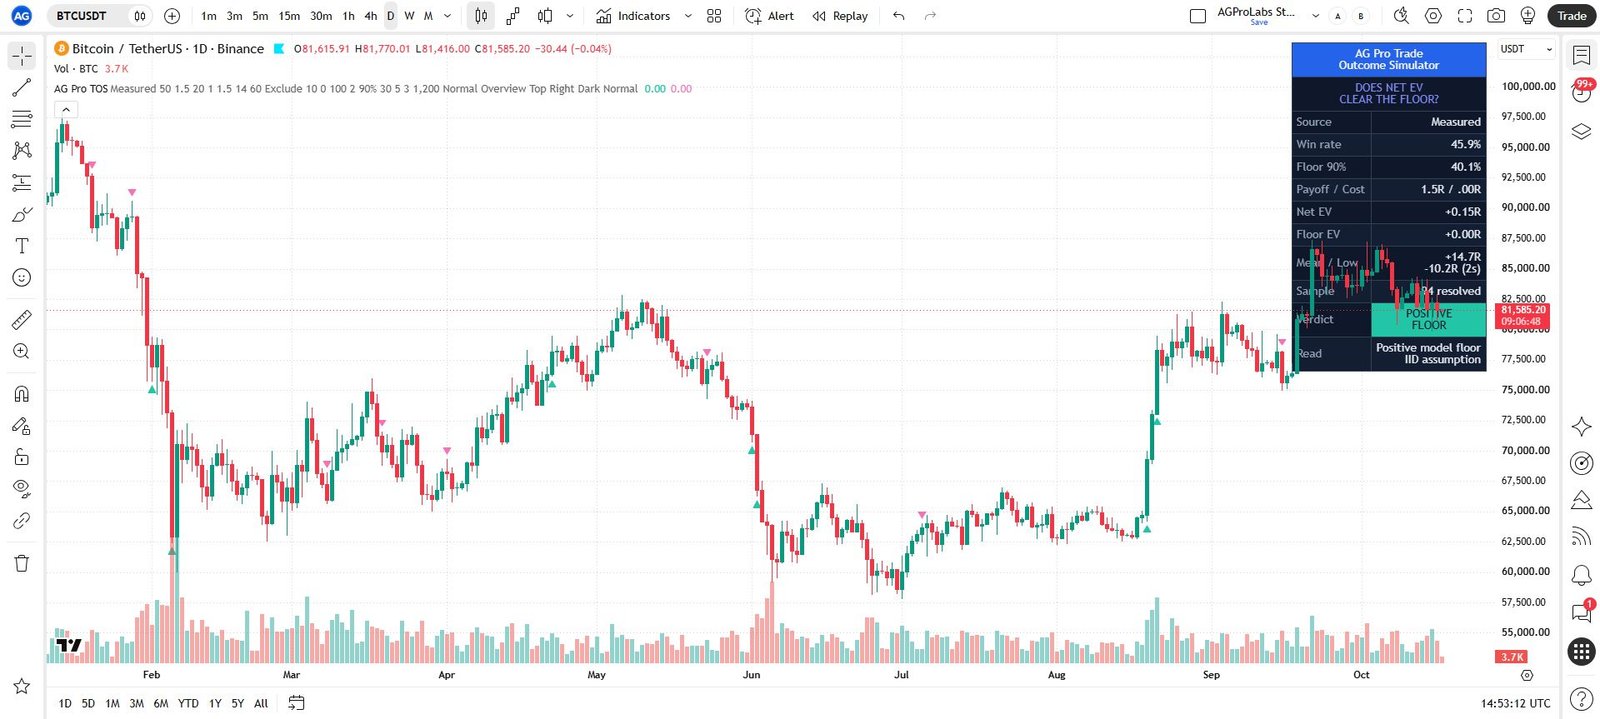
Edge Source
3 inputsWin rate & payoff
- Input type
string- Source default
"Measured"- Available options
["Measured", "Manual"]- Minimum
Not specified in source- Maximum
Not specified in source- Step
Not specified in source
What it controls
Measured derives win rate from confirmed target/stop resolutions on this chart.
Effect on the script
Manual uses the supplied W and R assumptions. Neither mode guarantees that future outcomes will match the model.
When to adjust it
Use the source that matches the question being studied and keep its origin clear when comparing outputs.
Interpretation and limits
Manual uses the supplied W and R assumptions.
Original input tooltip
Measured derives win rate from confirmed target/stop resolutions on this chart. Manual uses the supplied W and R assumptions. Neither mode guarantees that future outcomes will match the model.
Manual win rate %
- Input type
float- Source default
50.0- Available options
Not specified in source- Minimum
1.0- Maximum
99.0- Step
Not specified in source
What it controls
Assumed probability of a positive fixed-payoff outcome in Manual mode.
Effect on the script
This is not measured evidence.
When to adjust it
Update it when the independently documented scenario or evidence supporting the manual assumption changes.
Interpretation and limits
This is not measured evidence.
Original input tooltip
Assumed probability of a positive fixed-payoff outcome in Manual mode. This is not measured evidence.
Manual payoff (R)
- Input type
float- Source default
1.5- Available options
Not specified in source- Minimum
0.1- Maximum
20.0- Step
0.1
What it controls
Assumed gross win payoff per unit of initial risk in Manual mode.
Effect on the script
Supplies the fixed winning payoff assumption, expressed in units of initial modeled risk.
When to adjust it
Adjust it when comparing an explicitly stated payoff scenario, alongside win rate and modeled costs.
Interpretation and limits
A requested payoff is not an achieved average return or a guarantee of execution.
Original input tooltip
Assumed gross win payoff per unit of initial risk in Manual mode.
Measured Engine
8 inputsBreakout lookback
- Input type
int- Source default
20- Available options
Not specified in source- Minimum
2- Maximum
200- Step
Not specified in source
What it controls
Confirmed close breakout against the preceding close-based range.
Effect on the script
One measured slot can be active at a time.
When to adjust it
Change it when comparing a different analytical horizon and record the configuration alongside the observations.
Interpretation and limits
Different windows produce different contexts and are not evidence of an improved future result.
Original input tooltip
Confirmed close breakout against the preceding close-based range. One measured slot can be active at a time.
Stop distance (×ATR)
- Input type
float- Source default
1.0- Available options
Not specified in source- Minimum
0.1- Maximum
10.0- Step
0.1
What it controls
Fixed initial stop distance using the entry-bar ATR normalization.
Effect on the script
Outcome counting is not an execution model.
When to adjust it
Change it only when the specific analytical or presentation question in the tooltip changes.
Interpretation and limits
Outcome counting is not an execution model.
Original input tooltip
Fixed initial stop distance using the entry-bar ATR normalization. Outcome counting is not an execution model.
Target payoff (R)
- Input type
float- Source default
1.5- Available options
Not specified in source- Minimum
0.1- Maximum
20.0- Step
0.1
What it controls
Target distance as a multiple of the stop distance; this is the payoff R used in the projection.
Effect on the script
Applies this parameter to the component and behavior stated in its source tooltip.
When to adjust it
Change it only when the specific analytical or presentation question in the tooltip changes.
Interpretation and limits
Record the configuration when comparing observations; a changed setting is not proof of a stronger future result.
Original input tooltip
Target distance as a multiple of the stop distance; this is the payoff R used in the projection.
ATR length
- Input type
int- Source default
14- Available options
Not specified in source- Minimum
1- Maximum
100- Step
Not specified in source
What it controls
ATR measurement window used for fixed model distances and schematic rail spacing.
Effect on the script
Changes the ATR measurement window used by the documented volatility and distance calculations.
When to adjust it
Adjust it only when deliberately comparing a different volatility baseline.
Interpretation and limits
A different ATR unit changes the reference context; it does not make adverse price movement safely bounded.
Original input tooltip
ATR measurement window used for fixed model distances and schematic rail spacing.
Max bars to resolve
- Input type
int- Source default
60- Available options
Not specified in source- Minimum
3- Maximum
500- Step
Not specified in source
What it controls
Unresolved slots are excluded after this many completed bars and reported separately.
Effect on the script
Changes the time window or deadline in which the documented event and follow observations are evaluated.
When to adjust it
Change it when studying another explicitly defined event or observation horizon.
Interpretation and limits
Unresolved slots are excluded after this many completed bars and reported separately.
Original input tooltip
Unresolved slots are excluded after this many completed bars and reported separately.
Same-bar target & stop
- Input type
string- Source default
"Exclude"- Available options
["Exclude", "Stop First", "Target First"]- Minimum
Not specified in source- Maximum
Not specified in source- Step
Not specified in source
What it controls
Historical OHLC bars do not reveal which level was touched first.
Effect on the script
Exclude avoids assigning an unknowable result; Stop First is conservative; Target First assigns the target. An opening price already at or beyond an edge takes precedence, since the open precedes the remaining OHLC path. Wins and losses still use fixed model payoffs, not gap-adjusted execution returns.
When to adjust it
Use it for a stated ambiguity-policy comparison while keeping all other observation settings fixed.
Interpretation and limits
Wins and losses still use fixed model payoffs, not gap-adjusted execution returns.
Original input tooltip
Historical OHLC bars do not reveal which level was touched first. Exclude avoids assigning an unknowable result; Stop First is conservative; Target First assigns the target. An opening price already at or beyond an edge takes precedence, since the open precedes the remaining OHLC path. Wins and losses still use fixed model payoffs, not gap-adjusted execution returns.
Min samples
- Input type
int- Source default
10- Available options
Not specified in source- Minimum
2- Maximum
200- Step
Not specified in source
What it controls
Resolved wins plus losses required before the measured outcome rail is displayed.
Effect on the script
Excluded and expired slots do not count.
When to adjust it
Use it to specify the minimum amount of eligible evidence required for the review.
Interpretation and limits
Excluded and expired slots do not count.
Original input tooltip
Resolved wins plus losses required before the measured outcome rail is displayed. Excluded and expired slots do not count.
Win / loss markers
- Input type
bool- Source default
true- Available options
Not specified in source- Minimum
Not specified in source- Maximum
Not specified in source- Step
Not specified in source
What it controls
Shows historical resolved model outcomes; markers are not trade entries or actual fills.
Effect on the script
Controls visibility of the chart element named by this setting.
When to adjust it
Toggle it to inspect that element or make space for the current chart review.
Interpretation and limits
A visibility switch does not turn a visual reference into an executed order or validated result.
Original input tooltip
Shows historical resolved model outcomes; markers are not trade entries or actual fills.
Projection
5 inputsRound-trip cost (R)
- Input type
float- Source default
0.0- Available options
Not specified in source- Minimum
0.0- Maximum
5.0- Step
0.01
What it controls
Fixed modeled cost subtracted from each outcome, in units of the initial stop distance.
Effect on the script
Includes your assumed fees and slippage. Zero retains the gross model. This is a scenario assumption, not measured execution cost.
When to adjust it
Change it when the scenario needs a different explicit round-trip fee/slippage assumption.
Interpretation and limits
This is a scenario assumption, not measured execution cost.
Original input tooltip
Fixed modeled cost subtracted from each outcome, in units of the initial stop distance. Includes your assumed fees and slippage. Zero retains the gross model. This is a scenario assumption, not measured execution cost.
Series length (trades)
- Input type
int- Source default
100- Available options
Not specified in source- Minimum
5- Maximum
1000- Step
Not specified in source
What it controls
How many repetitions of this setup to project the outcome distribution over.
Effect on the script
Sets the number of repetitions used in the repeated-outcome calculation.
When to adjust it
Change it when examining a different stated series horizon under the same assumptions.
Interpretation and limits
A longer modeled series does not ensure independence or stability of the assumed edge.
Original input tooltip
How many repetitions of this setup to project the outcome distribution over.
Outcome band (σ)
- Input type
float- Source default
2.0- Available options
Not specified in source- Minimum
1.0- Maximum
4.0- Step
0.5
What it controls
Standard-deviation multiple used for the upper and lower terminal outcome bands.
Effect on the script
These are moment-based reference levels, not best/worst outcomes or pathwise drawdown estimates.
When to adjust it
Use it to compare moment-based dispersion references for the same series model.
Interpretation and limits
These are moment-based reference levels, not best/worst outcomes or pathwise drawdown estimates.
Original input tooltip
Standard-deviation multiple used for the upper and lower terminal outcome bands. These are moment-based reference levels, not best/worst outcomes or pathwise drawdown estimates.
Confidence level
- Input type
string- Source default
"90%"- Available options
["80%", "90%", "95%"]- Minimum
Not specified in source- Maximum
Not specified in source- Step
Not specified in source
What it controls
Confidence level used for the Wilson lower bound of the measured win rate.
Effect on the script
Higher settings demand stronger evidence before a positive model floor is reported. The selected z-value corresponds to the lower endpoint of a two-sided Wilson interval, under binomial assumptions.
When to adjust it
Compare confidence assumptions while keeping the observed sample and payoff definition unchanged.
Interpretation and limits
The selected z-value corresponds to the lower endpoint of a two-sided Wilson interval, under binomial assumptions.
Original input tooltip
Confidence level used for the Wilson lower bound of the measured win rate. Higher settings demand stronger evidence before a positive model floor is reported. The selected z-value corresponds to the lower endpoint of a two-sided Wilson interval, under binomial assumptions.
Robust sample threshold
- Input type
int- Source default
30- Available options
Not specified in source- Minimum
10- Maximum
500- Step
Not specified in source
What it controls
Minimum number of resolved measured outcomes required before a positive net confidence-floor expectancy can receive the POSITIVE FLOOR verdict.
Effect on the script
This is a model condition, not proof of future profitability.
When to adjust it
Use it to specify the minimum amount of eligible evidence required for the review.
Interpretation and limits
This is a model condition, not proof of future profitability.
Original input tooltip
Minimum number of resolved measured outcomes required before a positive net confidence-floor expectancy can receive the POSITIVE FLOOR verdict. This is a model condition, not proof of future profitability.
Visuals
5 inputsOn-chart outcome strip
- Input type
bool- Source default
true- Available options
Not specified in source- Minimum
Not specified in source- Maximum
Not specified in source- Step
Not specified in source
What it controls
Shows the R-denominated outcome schematic beside price.
Effect on the script
Vertical position and spacing are decorative, not price targets.
When to adjust it
Toggle it to inspect that element or make space for the current chart review.
Interpretation and limits
A visibility switch does not turn a visual reference into an executed order or validated result.
Original input tooltip
Shows the R-denominated outcome schematic beside price. Vertical position and spacing are decorative, not price targets.
Strip offset (bars)
- Input type
int- Source default
5- Available options
Not specified in source- Minimum
1- Maximum
30- Step
Not specified in source
What it controls
Additional horizontal offset in chart bars.
Effect on the script
An eight-bar clearance is included to separate the schematic badges from the latest candle.
When to adjust it
Adjust it when the available forward chart space or the intended visual review area changes.
Interpretation and limits
Drawing farther to the right does not extend event validity or establish that price will reach a reference.
Original input tooltip
Additional horizontal offset in chart bars. An eight-bar clearance is included to separate the schematic badges from the latest candle.
Strip spacing (×ATR)
- Input type
float- Source default
3.0- Available options
Not specified in source- Minimum
0.5- Maximum
15.0- Step
0.5
What it controls
Vertical gap between outcome badges, in ATR units — keeps the strip evenly spread on any symbol or timeframe.
Effect on the script
Applies this parameter to the component and behavior stated in its source tooltip.
When to adjust it
Change it only when the specific analytical or presentation question in the tooltip changes.
Interpretation and limits
Record the configuration when comparing observations; a changed setting is not proof of a stronger future result.
Original input tooltip
Vertical gap between outcome badges, in ATR units — keeps the strip evenly spread on any symbol or timeframe.
Win / loss marker history
- Input type
int- Source default
1200- Available options
Not specified in source- Minimum
100- Maximum
5000- Step
Not specified in source
What it controls
Limits measured win/loss markers to recent chart history, preserving context without rendering the entire dataset.
Effect on the script
Applies this parameter to the component and behavior stated in its source tooltip.
When to adjust it
Change it only when the specific analytical or presentation question in the tooltip changes.
Interpretation and limits
Record the configuration when comparing observations; a changed setting is not proof of a stronger future result.
Original input tooltip
Limits measured win/loss markers to recent chart history, preserving context without rendering the entire dataset.
Label size
- Input type
string- Source default
"Normal"- Available options
["Tiny", "Small", "Normal", "Large"]- Minimum
Not specified in source- Maximum
Not specified in source- Step
Not specified in source
What it controls
Font size for all outcome badges.
Effect on the script
Normal is the default.
When to adjust it
Adjust it for the chart size and viewing distance while preserving readable boundaries and state information.
Interpretation and limits
A larger font can increase chart overlap. Text size does not change the analytical observations.
Original input tooltip
Font size for all outcome badges. Normal is the default.
Decision Panel
5 inputsPanel page
- Input type
string- Source default
"Overview"- Available options
["Overview", "Audit"]- Minimum
Not specified in source- Maximum
Not specified in source- Step
Not specified in source
What it controls
Overview shows the net repeated-outcome model.
Effect on the script
Audit exposes resolved, excluded, expired and opening-gap observations. Manual mode displays assumptions rather than measured evidence.
When to adjust it
Use the current-state view for orientation and the available evidence/audit view when checking observation provenance and exclusions.
Interpretation and limits
Manual mode displays assumptions rather than measured evidence.
Original input tooltip
Overview shows the net repeated-outcome model. Audit exposes resolved, excluded, expired and opening-gap observations. Manual mode displays assumptions rather than measured evidence.
Show panel
- Input type
bool- Source default
true- Available options
Not specified in source- Minimum
Not specified in source- Maximum
Not specified in source- Step
Not specified in source
What it controls
Shows the compact outcome panel.
Effect on the script
Controls whether the workflow table is rendered on the chart.
When to adjust it
Show the panel to inspect the state and evidence, or hide it when chart space is the immediate priority.
Interpretation and limits
Hiding the panel is a presentation choice; do not treat missing rows as missing risk.
Original input tooltip
Shows the compact outcome panel.
Panel position
- Input type
string- Source default
"Top Right"- Available options
["Top Right", "Top Left", "Bottom Right", "Bottom Left", "Middle Right"]- Minimum
Not specified in source- Maximum
Not specified in source- Step
Not specified in source
What it controls
Panel location on the chart.
Effect on the script
Selects the table position used by the panel renderer.
When to adjust it
Move the panel when it overlaps active candles, the current workflow zone, or reference labels.
Interpretation and limits
Panel placement changes presentation, not the detected context or observation accounting.
Original input tooltip
Panel location on the chart.
Theme
- Input type
string- Source default
"Dark"- Available options
["Dark", "Light"]- Minimum
Not specified in source- Maximum
Not specified in source- Step
Not specified in source
What it controls
Dark or light panel contrast scheme.
Effect on the script
Selects the panel background, border, and text color scheme used for contrast.
When to adjust it
Choose the available theme that keeps the panel readable against the chart background.
Interpretation and limits
A theme changes appearance; it does not change event qualification or statistical evidence.
Original input tooltip
Dark or light panel contrast scheme.
Panel font size
- Input type
string- Source default
"Normal"- Available options
["Tiny", "Small", "Normal", "Large"]- Minimum
Not specified in source- Maximum
Not specified in source- Step
Not specified in source
What it controls
Panel font size; Normal is the default.
Effect on the script
Controls the text-size mapping used by the relevant panel or chart-label renderer.
When to adjust it
Adjust it for the chart size and viewing distance while preserving readable boundaries and state information.
Interpretation and limits
A larger font can increase chart overlap. Text size does not change the analytical observations.
Original input tooltip
Panel font size; Normal is the default.
Keep the settings in context
Change one analytical assumption at a time and compare the same instrument, timeframe and history. A chart reference, score, observation rate or input default does not establish a trade fill, a forward probability or a guaranteed outcome.
Return to the product overview · View this script on TradingView