
Dynamic Price Channels: Read Trend Structure Beyond Static Lines
Learn how major, minor, external and internal price channels can organize trend structure without turning projected rails into forecasts.
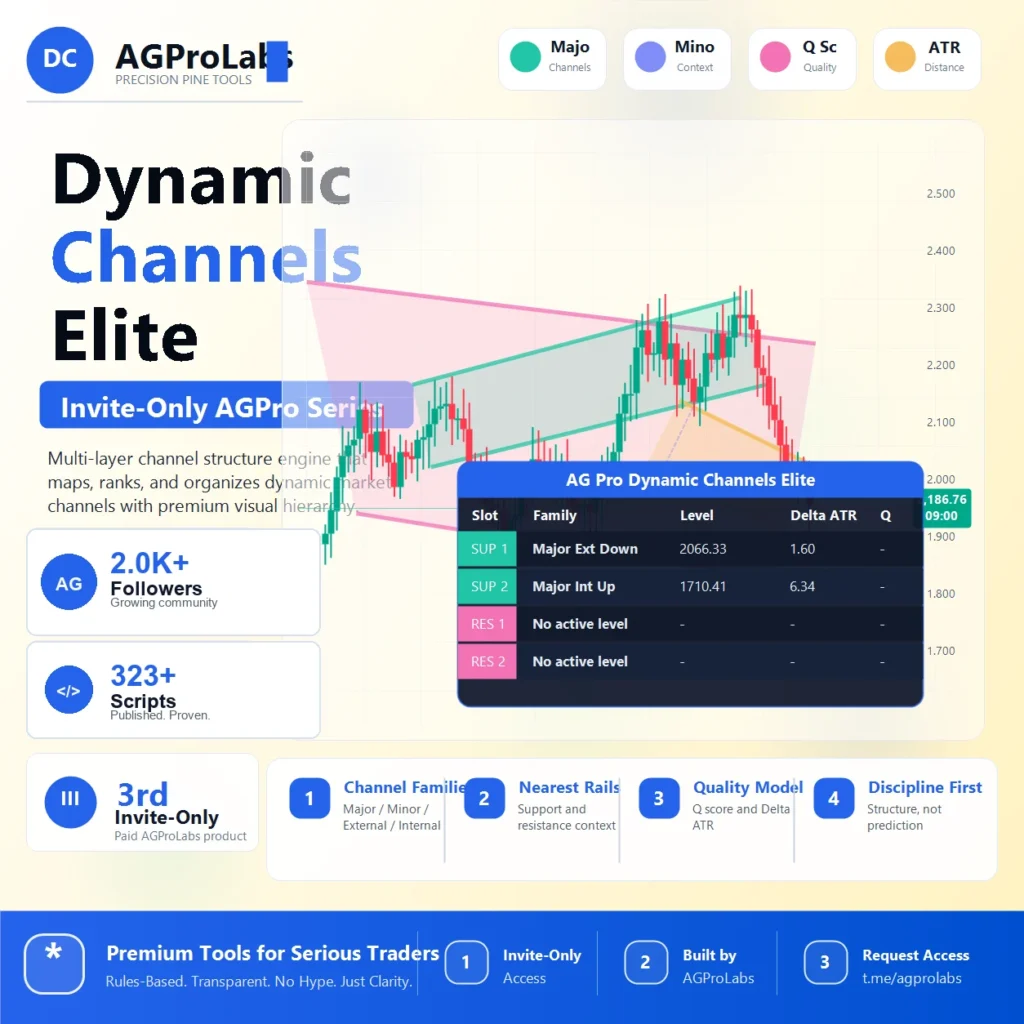
Price channels are often presented as two parallel lines, yet real market structure is rarely that simple. A large directional channel can contain a corrective internal channel, a faster minor rhythm and older rails that no longer deserve equal attention. Dynamic channel analysis tries to organize this hierarchy.
What is a dynamic price channel?
A price channel maps directional geometry using two boundaries derived from recent data, often pivots, regression or volatility. A dynamic channel updates as the market creates new structure. It is descriptive: it summarizes how price has been moving. It does not require price to continue respecting the same rails.
The most important question is not “Did price touch the line?” It is “What structural role does this channel play, and is that role still active?”
Major, minor, external and internal channel families
- Major channels describe broader structural rhythm and usually update more slowly.
- Minor channels capture faster movement or compression inside the larger context.
- External channels frame wider outside boundaries.
- Internal channels organize nested movement within a broader structure.
These families can overlap. An internal bearish channel may exist inside a major bullish channel, describing a correction rather than a complete trend reversal. Treating both as context avoids forcing one line to explain every timeframe.
How pivot-based channels are constructed
Confirmed pivot highs and lows provide reference points. Candidate rails are built from relationships among those pivots, then evaluated for direction, width, consistency and relevance. More sensitive pivot settings produce faster structures but also more noise. Slower settings can create cleaner channels but respond later.
Dynamic Channels Elite [AGPro Series] applies this logic across eight channel families. It maps channel bodies, projects rails, identifies a dominant focus and ranks nearby support or resistance context.
Quality scores and ATR-normalized distance
A rule-based quality score can help compare channel candidates, but it is not a success probability. It reflects how well the channel matches the model’s internal criteria. A high score can still fail when volatility changes or new pivots alter the structure.
Distance measured in ATR makes rail proximity easier to compare across symbols. A fixed dollar distance means something different for BTC, an altcoin and an equity. ATR normalization describes distance relative to recent volatility, but it does not estimate execution risk or guarantee reaction.
How to read a channel reaction
- Identify the dominant broader channel family.
- Check whether price is near an external or internal rail.
- Review the direction and quality of the nested channel.
- Inspect volatility, participation and nearby structure.
- Define what would invalidate the reaction scenario.
- Wait for an explicit confirmation rather than assuming the rail must hold.
A rail becomes more meaningful when it aligns with independent context such as prior structure, volume-weighted reference, liquidity event or broader timeframe state. Alignment is confluence, not certainty.
Channel breaks need context
A line break can represent expansion, a temporary wick, a failed auction or the beginning of new structure. Evaluate whether the break is confirmed, whether participation expands and whether price can hold outside the channel. Then inspect where the next major family sits.
Do not automatically treat a break as a trade signal. The market may return inside the channel, form a new internal structure or invalidate the previous geometry completely.
Combine channel structure with broader market context
Channel tools specialize in geometry; they should not carry the entire analysis. Trading Suite can add regime, multi-timeframe, volume, liquidity and scenario-risk context around a structural observation. The tools answer different questions and should not be counted as duplicate votes.
When dynamic channels become weak
- Illiquid symbols with irregular wicks
- News shocks and sudden volatility expansion
- Very low timeframes with unstable pivot rhythm
- New listings with limited history
- Gapping instruments or interrupted sessions
- Settings tuned too sensitively for the selected market
No channel model can make chaotic data orderly. When multiple families conflict and quality deteriorates, the correct analytical state may be neutral.
A clean channel-analysis workflow
Start with a broad pivot setting and major external structure. Add internal channels only when they clarify the current move. Keep the number of projected rails restrained. Use the nearest relevant support and resistance context, note ATR distance, and define invalidation before considering confirmation. Retire stale geometry as new pivots become structurally dominant.
Sources and further reading
- TradingView: Technical analysis essentials
- TradingView Pine Script: Lines and boxes
- Dynamic Channels Elite methodology and limitations
Educational and risk disclosure
This guide is educational and analytical. It is not financial advice, a recommendation, a prediction, or a promise of results. Markets involve risk, including loss of capital. Verify information independently and remain responsible for your own decisions, execution and risk limits.
See the systems behind the framework.
Review the real interfaces, methodology, limitations and access terms before deciding whether an AGProLabs workflow fits your process.