
How to Monitor Multiple Crypto Exchanges from One TradingView Workflow
A practical guide to scanning crypto symbols across multiple exchange feeds, ranking attention and validating data before a decision.
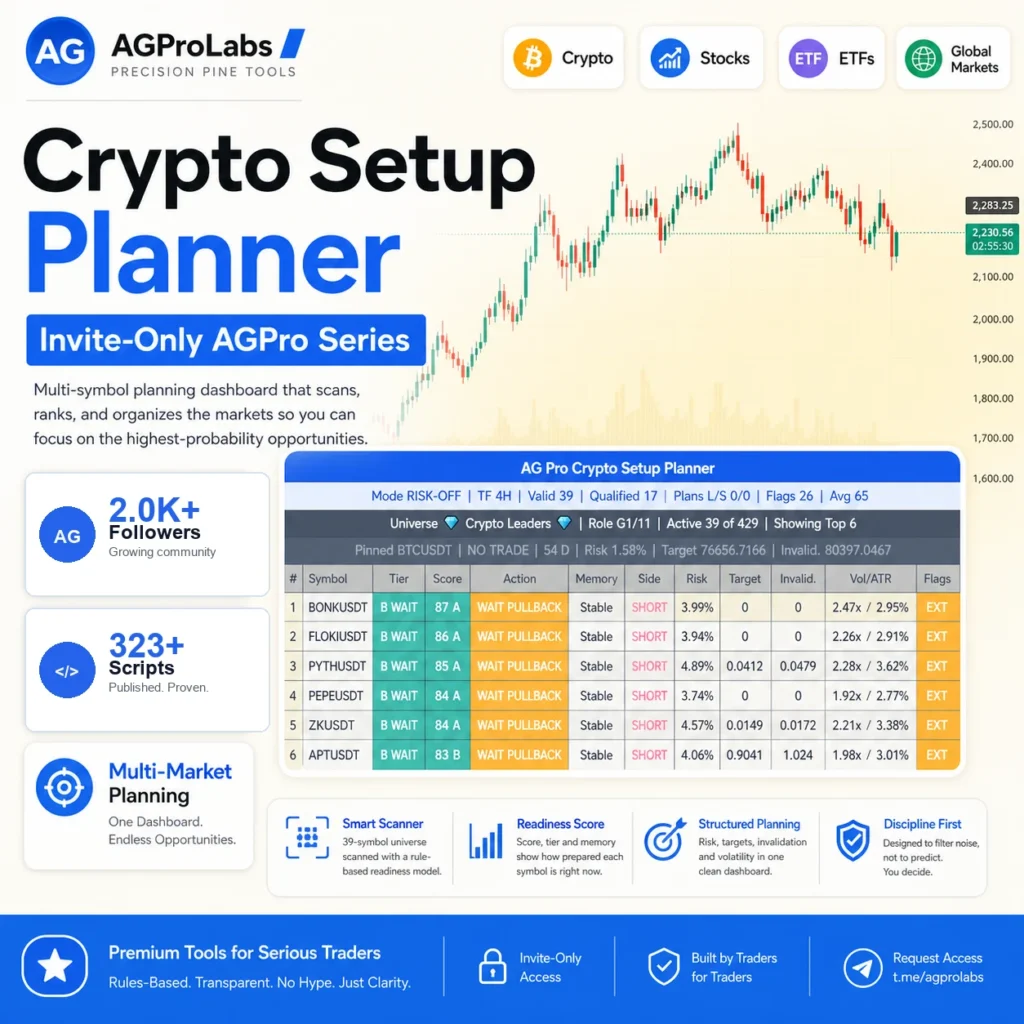
Crypto markets trade across many venues, and the same asset can show different volume, spread, liquidity and price behavior on different exchange feeds. Monitoring multiple exchanges can broaden opportunity review, but it can also multiply noise. The solution is a two-stage workflow: screen consistently, then validate selectively.
Why the exchange feed matters
A TradingView ticker identifies both the instrument and its data source. BTCUSDT on one exchange is not the same feed as BTCUSDT on another. Price is often similar, yet candles, volume, wicks, session behavior and temporary dislocations may differ.
Before comparing symbols, use a consistent quote currency where possible and verify that the selected feeds have adequate history, liquidity and volume data. A ranking becomes less useful when one symbol is active and another is a thin or unstable market.
Build a deliberate symbol universe
A useful universe is broad enough to capture rotation but small enough to validate. Organize tickers by role rather than collecting everything available:
- Large-cap market leaders
- High-liquidity altcoins
- Sector or narrative groups
- Exchange-specific listings
- Defensive or benchmark instruments
Keep one canonical feed for each asset unless the purpose is specifically to compare venues. This prevents the top of the ranking from filling with duplicate versions of the same underlying move.
Use one screening logic across the universe
Multi-market review becomes meaningful when every active symbol is evaluated with the same framework. A balanced model may include:
- Fast, slow and macro trend alignment
- Recent structure position and expansion
- Momentum without treating overbought or oversold as automatic reversal
- Participation and relative volume context
- Volatility and ATR-normalized distance
- Risk flags for extension, poor liquidity or conflicting evidence
Crypto Setup Planner [AGPro Series] applies this principle to an active 39-symbol universe. Its selectable groups can contain symbols from multiple exchange feeds, enabling broad cross-market review while staying within the active analysis set.
Interpret rankings as attention priority
A high score is not a trade recommendation. It says that a symbol currently satisfies more of the active readiness rules than lower-ranked candidates. The next step is to open the chart and verify location, structure, liquidity and current execution conditions.
Preserve states such as WATCH, WAIT PULLBACK, WAIT VOL and risk flags. If every row becomes PLAN, the framework is no longer filtering.
Can one workflow monitor around ten exchanges?
Yes, an active symbol group can be constructed from listings across roughly ten venues when those tickers are available on TradingView. The practical limit is the active symbol universe and TradingView’s data/request constraints, not a promise that every exchange or instrument will always be available.
Exchange coverage should therefore be treated as configurable data selection. Confirm symbols inside TradingView, avoid unavailable tickers, and replace feeds that produce inconsistent or missing data. The script does not connect directly to exchange accounts and does not place orders.
Validate every shortlisted market
- Open the exact ticker and exchange feed used by the scan.
- Check the broader market regime and benchmark direction.
- Inspect nearby structure, liquidity and value references.
- Confirm that participation and volatility are usable.
- Identify the event that would invalidate the scenario.
- Check spread, slippage, fees and account-specific constraints.
For an integrated second-stage chart review, Trading Suite connects market state, timeframe context, structure and scenario risk in one workspace. The planner narrows attention; the flagship supports deeper analysis.
Data-quality and market-risk limitations
- Different exchanges can publish different volume and candle histories.
- New listings may have insufficient data for stable lookbacks.
- Fast markets can make a recently calculated ranking stale.
- Thin order books can produce attractive chart movement with poor execution quality.
- Stablecoin or quote-currency differences can affect comparison.
- Exchange outages, symbol changes and data gaps can invalidate a row.
A practical multi-exchange routine
Begin by selecting one active group and one scan timeframe. Review the group-level mode and risk flags, then shortlist a small number of high-readiness or watch candidates. Open only those charts, validate the exact feed, and reject any candidate with poor location or unusable risk. Repeat the scan at predefined intervals rather than reacting to every ranking change.
Screening saves attention. It does not remove the need for independent chart analysis, account risk management or exchange due diligence.
Sources and further reading
- TradingView: What is Pine Script?
- TradingView markets and symbols
- Crypto Setup Planner methodology and limitations
Educational and risk disclosure
This guide is educational and analytical. It is not financial advice, a recommendation, a prediction, or a promise of results. Markets involve risk, including loss of capital. Verify information independently and remain responsible for your own decisions, execution and risk limits.
See the systems behind the framework.
Review the real interfaces, methodology, limitations and access terms before deciding whether an AGProLabs workflow fits your process.