
A Disciplined Framework for Crypto and Stock Market Analysis
A practical framework for market psychology, context, technical analysis, confirmation, risk and post-decision review without impulsive conclusions.
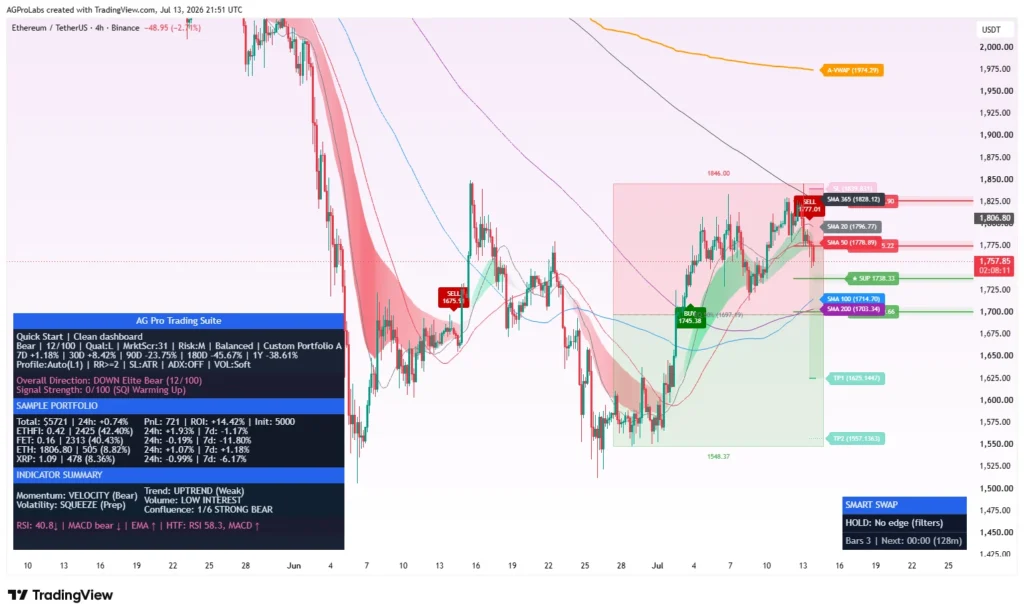
Crypto and stock market analysis becomes fragile when observation, interpretation and action happen at the same time. A fast candle, a compelling headline or a familiar pattern can create urgency before the broader context has been checked. A disciplined framework slows that sequence down and makes each decision easier to audit.
Market psychology comes before technical analysis
The first risk is not a chart pattern; it is the trader’s relationship with uncertainty. Fear of missing out can turn a developing condition into an imagined certainty. Loss aversion can make invalidation feel optional. Recency bias can give the latest move more weight than the larger structure.
A practical defense is to write the question before searching for the answer. Are you reviewing trend continuation, a range reaction, a liquidity event, a volatility expansion or portfolio rotation? A defined question prevents unrelated indicators from becoming after-the-fact justification.
Do not ask, “Will price rise?” Ask, “What evidence defines the current state, what would challenge that interpretation, and where would the scenario become invalid?”
Step 1: classify market context
Begin with environment rather than entry. Review whether the market is directional, ranging, compressed, volatile, liquid or conflicted. Compare the active timeframe with one or two broader contexts. The purpose is not to force agreement. Timeframe conflict is valuable information.
- Trend: Is directional structure persistent or repeatedly failing?
- Volatility: Is range expanding, contracting or behaving abnormally?
- Participation: Does volume or activity support the move?
- Liquidity: Is price approaching a region where reactions or sweeps may occur?
- Regime: Does the current environment reward continuation logic or mean-reversion logic?
This is where an integrated workspace such as Trading Suite [AGPro Series] can reduce fragmentation. It keeps multi-factor state and higher-timeframe context in one visual hierarchy while retaining neutral and defensive outcomes.
Step 2: read location and structure
A condition can look attractive in isolation and still form at a poor location. Review recent swing structure, support and resistance, value regions, VWAP references, gaps, liquidity sweeps and nearby channel boundaries. The important question is not whether a line exists, but whether the current state is developing in a meaningful structural area.
Dynamic geometry deserves special care. A channel is created from historical pivots and can change relevance as new structure forms. Dynamic Channels Elite addresses this by separating major, minor, external and internal families instead of presenting one generic rail as the answer.
Step 3: define confirmation before it happens
Confirmation should be an explicit rule, not a feeling that becomes stricter after a loss and looser during excitement. Examples include a completed-bar transition, renewed participation, a structure reclaim, timeframe alignment or volatility returning to a usable range.
Completed-bar confirmation can reduce some intrabar changes, but it does not guarantee stability. New information can still invalidate a confirmed condition. Treat confirmation as one layer in the process, not the finish line.
Step 4: make invalidation visible
Risk planning begins before execution. Identify the market event that would challenge the scenario. That event may be a structure break, failed reclaim, volatility expansion, loss of a reference or a timeframe conflict becoming dominant.
Then separate market invalidation from account risk. A chart can suggest where the idea becomes weaker, but only the trader knows account size, leverage, fees, slippage, liquidity and personal risk limits. No script can calculate a responsible decision without that information.
Step 5: separate market selection from setup analysis
When dozens of crypto symbols are moving, opening charts one by one can create inconsistent attention. A broad planner can first rank markets under the same rules, after which the trader validates a smaller set in depth.
Crypto Setup Planner supports this two-stage process by scanning an active 39-symbol universe and surfacing readiness, side, risk, target, invalidation and caution states. It does not eliminate manual review; it helps decide where manual review should begin.
Step 6: review decisions, not only outcomes
A profitable trade can still result from a weak process, and a disciplined decision can still lose. Review whether the original context was correctly described, whether invalidation was respected and whether execution matched the plan. This prevents outcome bias from rewriting the quality of the decision.
- Record the market state and timeframe context.
- State the structural location and confirmation rule.
- Define invalidation before execution.
- Record why the market was selected.
- Review the process after the position is closed, independently of profit or loss.
Common analysis mistakes
- Using more indicators to avoid making a clear invalidation decision.
- Treating a high score or colored label as a complete plan.
- Switching timeframes until a desired conclusion appears.
- Ignoring exchange-feed, liquidity and spread differences.
- Increasing risk because several tools repeat variations of the same input.
- Confusing a compelling chart with a suitable trade for the account.
A repeatable daily workflow
- Prepare: choose the universe, session and timeframes before scanning.
- Classify: describe regime, volatility and participation.
- Locate: map structure, value and liquidity references.
- Filter: retain only markets with sufficient data quality and usable risk geometry.
- Confirm: wait for the predefined state change or reaction.
- Size independently: apply account-specific limits and execution constraints.
- Review: document whether the process was followed.
Sources and further reading
- TradingView: Technical analysis essentials
- Investor.gov: How stock markets work
- AGProLabs risk disclosure
Educational and risk disclosure
This guide is educational and analytical. It is not financial advice, a recommendation, a prediction, or a promise of results. Markets involve risk, including loss of capital. Verify information independently and remain responsible for your own decisions, execution and risk limits.
See the systems behind the framework.
Review the real interfaces, methodology, limitations and access terms before deciding whether an AGProLabs workflow fits your process.