
How to Read the Crypto Setup Planner Dashboard
Read a real TradingView dashboard in five steps: coverage, score, candidate quality, setup, flags and pinned-symbol context.
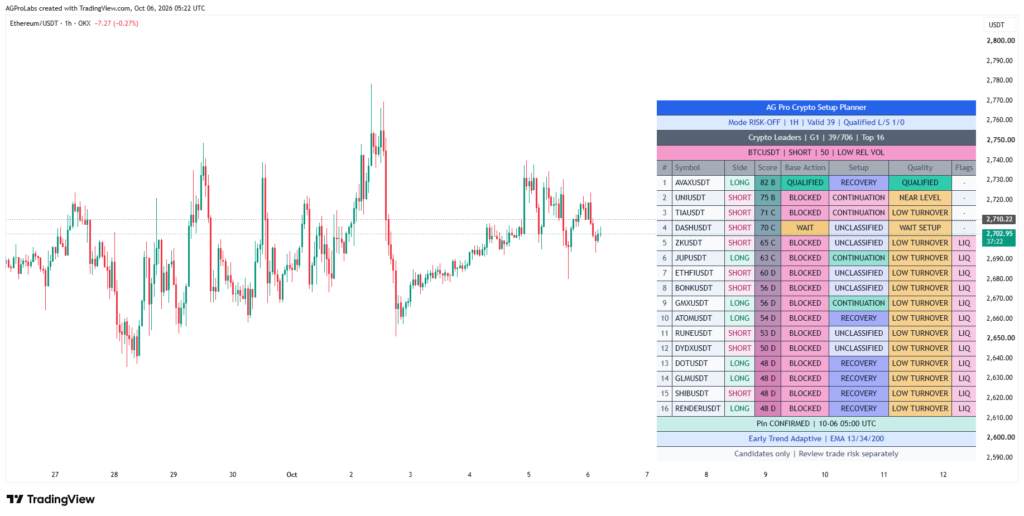
Crypto Setup Planner organizes a selected TradingView symbol basket into a ranked shortlist. Read the score together with the candidate state and quality reason to decide which charts deserve closer inspection.
The same screening workflow supports crypto, global stocks, ETFs and custom commodity instruments with suitable data. The real screenshot above demonstrates a crypto basket. Stock, ETF and commodity coverage follows your selected symbols and feeds; one instance evaluates one selected group of up to 39 symbols.
About the screenshot above: recorded on . An archived interface example, not a current market recommendation or a performance record. Open the original screenshot at full resolution ↗
AVAXUSDT is QUALIFIED at score 82 in this snapshot. UNIUSDT has score 75 but remains BLOCKED by NEAR LEVEL. Score ranks context; Quality explains whether the configured checks allow qualification.
1. Start with coverage and timeframe
The summary displays 1H, Valid 39 and Qualified L/S 1/0. The selected basket has 39 valid symbols, with one qualifying long candidate and no qualifying short candidates at the captured observation.
Top 16 controls how many rows are visible; it does not mean that only 16 symbols were evaluated. The 39/706 group line distinguishes the active group from the supplied catalog capacity shown in this snapshot. The catalog count is not a simultaneous scan count.
Check first: the selected group, source timeframe and usable coverage. Missing history, stale data or warmup can limit interpretation. The market mode summarizes context within the selected basket.
2. Read Side and Score together
In the first row, AVAXUSDT displays LONG and 82 B. LONG is the analytical bias; 82 is the context score and B is its score-band grade. An 82 score does not represent an 82% chance of a profitable trade.
UNIUSDT displays SHORT, 75 B and BLOCKED. Its relatively high score does not remove the quality constraint. Sorting helps prioritize inspection; it does not settle trade suitability.
Check next: whether current chart evidence supports the displayed direction, using the exact ticker and exchange or provider evaluated by the script.
3. Inspect Base Action and Quality
The captured dashboard contains four examples that show how the fields work together.
On a small screen, swipe the table horizontally to read every column.
| Captured row | Base Action | Quality | Practical reading |
|---|---|---|---|
| AVAXUSDT | QUALIFIED | QUALIFIED | Satisfies the configured qualification rules at this observation; review its own chart and execution conditions. |
| UNIUSDT | BLOCKED | NEAR LEVEL | A nearby opposing reference prevents qualification under the active checks. |
| TIAUSDT | BLOCKED | LOW TURNOVER | Participation/liquidity evidence is insufficient under the selected turnover rules. |
| DASHUSDT | WAIT | WAIT SETUP | The setup requirement remains incomplete. |
Quality provides a concise reason. A displayed first reason does not establish that every other requirement passes. Turnover is a volume-based proxy; it does not directly measure an order book or your executable spread.
Useful habit: inspect the explanation for a blocked candidate before promoting it in your own review process.
4. Use Setup and Flags to add context
The first row shows RECOVERY, while other rows show CONTINUATION or UNCLASSIFIED. These fields describe the detected setup family. They do not forecast how the next candle will behave.
Several blocked rows display LIQ, highlighting low current-bar turnover. A dash in Flags means that no flag is displayed in that field; qualification still needs to be read from Base Action and Quality.
Useful habit: read the entire row. Side, Score, Setup, Quality and Flags answer different parts of the screening question.
5. Keep the pinned symbol separate
The focus strip reads BTCUSDT | SHORT | 50 | LOW REL VOL. It concerns the pinned Bitcoin symbol. The background chart is Ethereum/USDT, and the table includes other instruments.
The pinned strip is a separate context reference. Do not apply its reading to the background chart simply because both appear in the same screenshot.
Next step: open the exact shortlisted instrument and verify current structure, data, participation and execution conditions. Entry, invalidation, costs and position risk require a separate review.
Using the workflow beyond crypto
Use the same panel language for global stock and ETF research. Prepared groups cover Borsa Istanbul, US stocks, India NSE, US ETFs, Germany XETRA, Hong Kong-listed instruments, Japan TSE and UK LSE. They are selected baskets rather than complete exchange inventories.
For commodity research, customize a group with exact TradingView identifiers. There is no dedicated ready-made commodity basket. Check the provider, instrument type, history, sessions and volume units. A cash quote, dated futures contract, continuous futures series, CFD and commodity ETF can represent materially different instruments. Missing or unsuitable volume may keep a row blocked.
The crypto screenshot establishes how to read this panel; it does not establish that a particular stock or commodity feed was tested successfully.
Set up the next market carefully: the stock and ETF configuration guide explains group selection, profile timing, session gaps and turnover units. Continue structural review with the dynamic-channel panel guide.
Continue your review
Educational and risk disclosure
This guide is educational and analytical. It is not financial advice, a recommendation, a prediction, or a promise of results. Markets involve risk, including loss of capital. Verify information independently and remain responsible for your own decisions, execution and risk limits.
See the systems behind the framework.
Review the real interfaces, methodology, limitations and access terms before deciding whether an AGProLabs workflow fits your process.